| Market Summary | Weekly Breakout Report | Top Breakout Choices | Top 2nd Chances | New Features | Tip of the Week |
We're back after
getting fresh powder every day at Mount Hood but my
attempts to snowboard confirmed that you can't teach an old dog new
tricks!
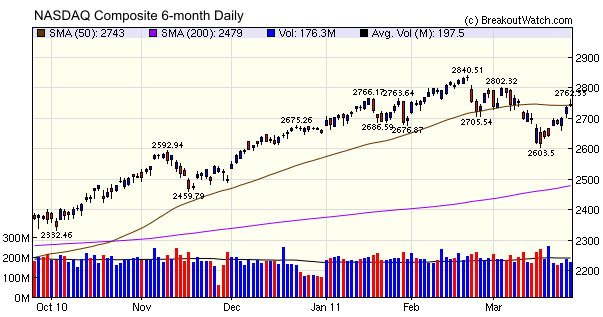
So what is the market telling us now? Our trend indicators say that the DJI, S&P 500 and Russell 2000 are in a primary uptrend but declining volumes indicate that this trend is losing momentum. Our chart of the NASDAQ Composite shows that the downward trend reversed at 2604 (close to our target of 2610 in our newsletter of 3/12/2011) but declining volume shows that there is a possible bull trap in the making. Although volume did spike on the third day of the rally, probably due to short covering, it has been below the 50 day average since. Although Friday began quite strongly, the index failed to hold above the 50 dma resistance level. If the index holds above that level the next test is at 2802 but I see a test of support at 2700 more likely.
So what is the market telling us now? Our trend indicators say that the DJI, S&P 500 and Russell 2000 are in a primary uptrend but declining volumes indicate that this trend is losing momentum. Our chart of the NASDAQ Composite shows that the downward trend reversed at 2604 (close to our target of 2610 in our newsletter of 3/12/2011) but declining volume shows that there is a possible bull trap in the making. Although volume did spike on the third day of the rally, probably due to short covering, it has been below the 50 day average since. Although Friday began quite strongly, the index failed to hold above the 50 dma resistance level. If the index holds above that level the next test is at 2802 but I see a test of support at 2700 more likely.
While I was away, there was a
discussion on the CANSLIM
mailing list
about whether or not there was a "follow through day" (FTD) in the
current trend reversal. This is not an indicator I am fond of, as, like
much of CANSLIM, its definition is fuzzy and therefore not easily
systematized. I examined the FTD rules and applied them to the three
major indexes and found there was a FTD on the DJI on the third day of
the rally but not for the NASDAQ Composite or S&P 500. A 3rd day
FTD is considered unreliable. However, the absence of an FTD does not
mean that this rally is not sustainable, but for the reasons given
above, it certainly looks questionable.
I've included an analysis of FTD's in this week's top tip.
I've included an analysis of FTD's in this week's top tip.
No new features this week.
The concept of the "follow through day" (FTD) was introduced by William O'Neil in his book, "How to Make Money in Stocks" (HTMSS). Its purpose is to increase confidence in when a market correction has run its course. If a FTD occurs shortly after a downward trend reversal, then the likelihood that the upward trend will continue is supposed to be enhanced. Conversely, if a FTD does not occur, then the rally is supposedly more likely to fail.
Since the concept was first introduced, the definition of a FTD has undergone several revisions. The 'Glossary' at Investors.com currently says: "a 'follow-through' day is identified when the index closes up 1.7% or more for the day on a significant increase in volume from the day before. The first two or three days of a rally are normally disregarded as it has not yet proven it will succeed and 'follow-through' with power and conviction. 'Follow-through' days therefore generally occur the fourth through seventh day of the attempted rally. They serve as a confirmation that the market has really changed direction and is in a new uptrend".
There are at least three problems with this definition which make it difficult for the investor to interpret when a FTD has occurred: "the index" is not defined, the first day of the rally is not defined and neither is "significant increase in volume".
Turning to HTMMS allows us to resolve most of these difficulties. The 3rd Edition, p. 65, refers only to the DOW index but says "A rally attempt begins when a major market average closes higher after a decline, either from earlier in the day or the previous session." On p. 66 we learn "The market's volume for the day should be above its average daily volume in addition to always being higher than the prior day's trading". (Note that the number of days to include in the average is left undefined. I could not find a definition either in HTMSS or on investors.com).
Based on the above we can now define the rules for a FTD:
- Day 1 of a tentative rally begins when a major index closes higher than the day's low or the previous day's close.
- On the fourth through seventh days of the rally there must be a close at least 1.7% higher than the previous close.
- On that day, the volume must exceed the previous day's volume.
- On that day, the volume must be higher than the average daily volume. We will use the commonly accepted 50 day moving average.
Now that we know how to recognize a FTD, is it useful? If so, it would confirm a new uptrend within a few days of a downward reversal allowing entry into the market with some confidence. On the other hand, if a FTD does not occur but the upward trend continues, then an opportunity to enter the market near the bottom will have been missed.
I looked at six reversal points in the current bull market including the market bottom using the DOW (see chart) and applied the rules above for the DOW (DJI), Nasdaq Composite (IXIC) and S&P 500 (SPX).
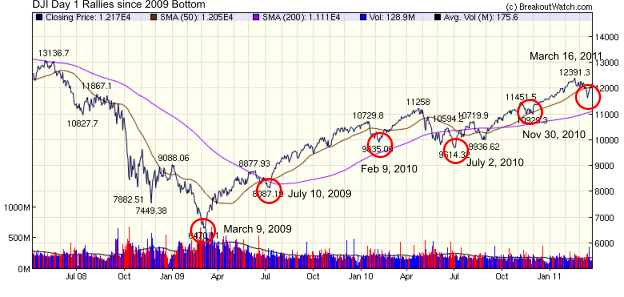
Although the rules suggest an FTD should be between the 4th and 7th day of the rally, I looked at each day until the 10th day. The table below shows the days in the rally when an FTD occurred.
| Day 1 Date |
Index |
FTD |
Day of
Rally |
Comment |
|---|---|---|---|---|
| 3/9/2009 |
DJI |
Yes |
2 |
Too early to be reliable |
| IXIC |
Yes |
2,4,8 |
Day 4 just right |
|
| SPX |
Yes |
2,8 |
Day 8 just acceptable |
|
| 7/10/2009 |
DJI |
Yes |
4 |
Just right |
| IXIC |
Yes |
4,10 |
Just right | |
| SPX |
Yes |
4,10 |
Just right | |
| 2/9/2010 |
DJI |
No |
||
| IXIC |
No |
|||
| SPX |
No |
|||
| 7/2/2010 |
DJI |
No |
||
| IXIC |
No |
|||
| SPX |
No |
|||
| 11/30/2010 |
DJI |
No |
||
| IXIC |
No |
|||
| SPX |
No |
|||
| 3/16/2011 |
DJI |
Yes |
3 |
Too early to be reliable |
| IXIC |
No |
|||
| SPX |
No |
The FTD rules were successful in confirming the market bottom of March 9, 2009 for the NASDAQ and S&P 500 but missed the bottom in the DJI which could have caused doubt that the bottom had been reached, particularly after such a long and deep decline. It correctly confirmed the trend reversal on July 7, 2009 in all three indexes. Since then, the FTD rules were not successful in detecting the trend reversals. If you relied on this signal alone to re-enter the market then you would have missed some important trend reversals.
This study has only looked at cases where an obvious downward trend reversal occurred and the ability of the FTD rules to detect that reversal. It has not looked at cases where an FTD occurred but a trend reversal did not eventuate.
Conclusion
Although the FTD rules did detect the March 9, 2009 market bottom in two out of three major indexes, the rules as construed here do not appear to constitute a reliable system for detecting downward trend reversals. The period of study was limited to only three years of a bull market, however, and a longer period of study may have given different results. The important question of does the system yield false positives was not examined.
Also not considered was the depth of the correction that must occur before the system can reliably detect a downward trend reversal.
You can download a spreadsheet of my analysis. Each reversal is on a different tab within the sheet.
| Index | Value | Change Week | Change YTD | Trend | ||||||||||||||||||||||||||||||||||||
|---|---|---|---|---|---|---|---|---|---|---|---|---|---|---|---|---|---|---|---|---|---|---|---|---|---|---|---|---|---|---|---|---|---|---|---|---|---|---|---|---|
| Dow | 12220.6 | 3.05% | 5.55% | Up | ||||||||||||||||||||||||||||||||||||
| NASDAQ | 2743.06 | 3.76% | 3.4% | Down | ||||||||||||||||||||||||||||||||||||
| S&P 500 | 1313.8 | 2.7% | 4.47% | Up | ||||||||||||||||||||||||||||||||||||
| Russell 2000 | 823.85 | 3.67% | 5.13% | Up | ||||||||||||||||||||||||||||||||||||
| Wilshire 5000 | 13883 | 2.85% | 4.46% | Up | ||||||||||||||||||||||||||||||||||||
1The Market Signal is derived
from our proprietary market model. The market model is described on the
site.
2The site also shows industry rankings based on fundamentals, combined technical and fundamentals, and on price alone. The site also shows daily industry movements. |
||||||||||||||||||||||||||||||||||||||||
|
# of Breakouts
|
Period Average1
|
Max. Gain During Period2
|
Gain at Period Close3
|
|
|---|---|---|---|---|
| This Week | 13 | 13.92 | 6.19% | 3.64% |
| Last Week | 20 | 14.62 | -2.01% | -3.57% |
| 13 Weeks | 234 | 15.38 | 11.48% |
1.99% |
2This represents the return if each stock were bought at its breakout price and sold at its intraday high.
3This represents the return if each stock were bought at its breakout price and sold at the most recent close.
|
Category
|
Symbol
|
Company Name
|
Expected Gain1
|
|---|---|---|---|
| Best Overall | MDM | Mountain Province Diamonds, Inc. | 115 |
| Top Technical | VIAS | Viasystems Group, Inc. | 40 |
| Top Fundamental | ODFL | Old Dominion Freight Line | 39 |
| Top Tech. & Fund. | ODFL | Old Dominion Freight Line | 39 |
|
Category
|
Symbol
|
Company Name
|
Expected Gain1
|
|---|---|---|---|
| Best Overall | UPI | Uroplasty, Inc. | 119 |
| Top Technical | UPI | Uroplasty, Inc. | 119 |
| Top Fundamental | ICLK | interCLICK Inc | 99 |
| Top Tech. & Fund. | ICLK | interCLICK Inc | 99 |
If you received this newsletter from a friend and you would like to receive it regularly please go to the BreakoutWatch.com site and enter as a Guest. You will then be able to register to receive the newsletter.
Copyright © 2011 NBIcharts, LLC dba BreakoutWatch.com.
All rights reserved.
" BreakoutWatch," the BreakoutWatch.com "eye" logo, and the slogan
"tomorrow's breakouts today" are service marks of NBIcharts LLC. All
other marks are the property of their respective owners, and are used
for descriptive purposes only.
BreakoutWatch is not affiliated with Investor's Business Daily
or with Mr. William O'Neil.
Our site, research and analysis is supported entirely by subscription
and is free from advertising.