| Market Summary | Weekly Breakout Report | Top Breakout Choices | Top 2nd Chances | New Features | Tip of the Week |
The markets had their strongest week since March 2009 after a group of central banks including the Federal Reserve promised to improve the liquidity of US dollars to ease inter-bank overnight lending rates. Increasing liquidity to the banks is good for stocks, as we have seen with the Fed's quantitative easing policies, so the shorts moved quickly to cover on Wednesday. By Friday the momentum was gone and the markets closed essentially flat on Friday.
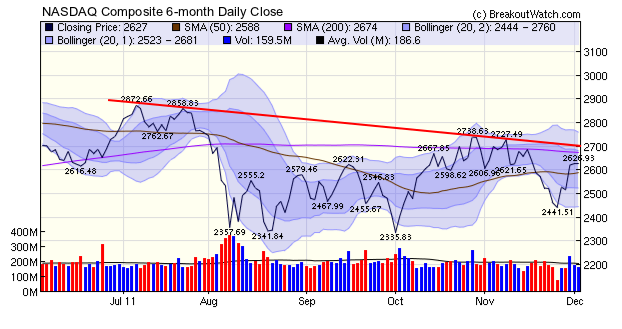
The week's gains and volume action were sufficient to turn our trend indicators to 'Up' for the Dow and S&P 500. While the short term trend is positive, the NASDAQ chart still shows that there is tough sleding ahead, although the rally could continue for a few more days yet. The daily close chart shows the downward resistance line about to intersect with the 200 day moving average. This will create strong resistance between 2670 and 2740. A breakthrough above those levels would be very bullish.
Wednesday's move higher on strong volume produced 49 breakout alerts with 29 confirmed. The total confirmed for the week rose to 42.
No new features this week.
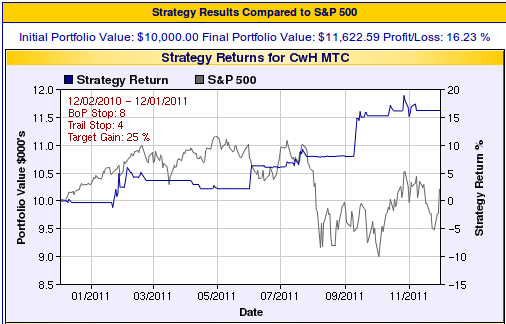
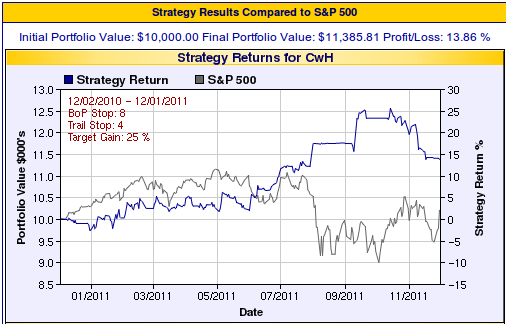
Trading Cups-with-Handle in a Volatile Market
We last discussed our suggestions for trading Cup-with-Handle breakouts in our March 13,2010 Newsletter. Given the somewhat chaotic market conditions in the last 12 months , which has seen the S&P 500 gain just 1.9%, we decided to do some further backtesting to see what has worked over that time period.
Use of Stop Losses
The recent volatility in the markets present a challenge with regard to setting stop losses. Our recommendation in March 2010 was for setting a stop loss on the breakout price of 8% and a trailing stop of 11%. We also suggested only using stocks that qualified for our MTC rating. Over the last year, however, using these values would have resulted in a loss of 15.5% on a four position portfolio. In other words, while the "let your winners run" dictum has worked in the past, in periods of high volatility it is a recipe for disaster.
We are now suggesting that a trailing stop value of 4% be used. Over the last year this would have yielded a gain of over 16% with a four position porfolio.
MTC Rating
Given thesechanges to our stop less suggestions, does this change our MTC rating? Well, we can definitely say that stocks that breakout with the MTC rating outperform all breakouts. With the 4% stop loss, a four position portfolio which bought on alert any stock meeting our basic breakout criteria earned 13.9%. This group does, of course, include the MTC stocks, so we can deduce that the return would have been worse if MTC stocks were excluded.
Buy on Alert or Buy on Breakout
With almost daily reversals of market direction, is it better to buy when an alert is issed, rather than wait for confirmation? Our backtest says that you definitely should buy on alert.
A backtest on MTC stocks with a 4% trailing stop loss showed that by waiting for confirmation your gain goes down to just 2.5% (but still better than the S&P 500). This suggests that our Gold level subscription, which includes real time alerts, is a better investment than our Silver level.
Buy on Alert but Sell if Unconfirmed
So you have bought on breakout alert but the stock doesn't meet the price and/or volume requirement at the end of the day, so should you sell at the next day's open? The backtest suggests no, hang-on to it until the 4% trailing stop kicks in. Selling at the next day's open gives a 14.2% return - reducing your potential profit by 2%.
| Index | Value | Change Week | Change YTD | Trend | ||||||||||||||||||||||||||||||||||||
|---|---|---|---|---|---|---|---|---|---|---|---|---|---|---|---|---|---|---|---|---|---|---|---|---|---|---|---|---|---|---|---|---|---|---|---|---|---|---|---|---|
| Dow | 12019.4 | 7.01% | 3.82% | Up | ||||||||||||||||||||||||||||||||||||
| NASDAQ | 2626.93 | 7.59% | -0.98% | Up | ||||||||||||||||||||||||||||||||||||
| S&P 500 | 1244.28 | 7.39% | -1.06% | Up | ||||||||||||||||||||||||||||||||||||
| Russell 2000 | 735.02 | 10.34% | -6.21% | Up | ||||||||||||||||||||||||||||||||||||
1The Market Signal is derived from our proprietary
market model. The market model is described on the site. 2The site also shows industry rankings based on fundamentals, combined technical and fundamentals, and on price alone. The site also shows daily industry movements. |
||||||||||||||||||||||||||||||||||||||||
# of Breakouts |
Period Average1 |
Max. Gain During Period2 |
Gain at Period Close3 |
|
|---|---|---|---|---|
| This Week | 42 | 20.69 | 3.65% | 0.76% |
| Last Week | 8 | 18.23 | 3.8% | 1.22% |
| 13 Weeks | 276 | 21.31 | 8.26% |
0.23% |
2This represents the return if each stock were bought at its breakout price and sold at its intraday high.
3This represents the return if each stock were bought at its breakout price and sold at the most recent close.
Category |
Symbol |
Company Name |
Expected Gain1 |
|---|---|---|---|
| Best Overall | PDFS | PDF Solutions, Inc. | 117 |
| Top Technical | UST | Altria Group, Inc. | 20 |
| Top Fundamental | MELI | MercadoLibre, Inc. | 0 |
| Top Tech. & Fund. | MELI | MercadoLibre, Inc. | 0 |
Category |
Symbol |
Company Name |
Expected Gain1 |
|---|---|---|---|
| Best Overall | CLFC | Center Financial Corporation | 92 |
| Top Technical | TOBC | Tower Bancorp, Inc. | 47 |
| Top Fundamental | WWD | Woodward Inc | 44 |
| Top Tech. & Fund. | ABMD | ABIOMED, Inc. | 73 |
If you received this newsletter from a friend and you would like to receive it regularly please go to the BreakoutWatch.com site and enter as a Guest. You will then be able to register to receive the newsletter.
Copyright © 2011 NBIcharts, LLC dba BreakoutWatch.com.
All rights reserved.
"
BreakoutWatch," the BreakoutWatch.com "eye" logo, and the
slogan "tomorrow's breakouts today" are service marks of NBIcharts
LLC. All other marks are the property of their respective owners, and are
used for descriptive purposes only.
BreakoutWatch is not affiliated with Investor's Business Daily or with Mr. William O'Neil.
Our site, research and analysis is supported entirely by subscription and is free from advertising.