| Market Summary | Weekly Breakout Report | Top Breakout Choices | Top 2nd Chances | New Features | Tip of the Week |
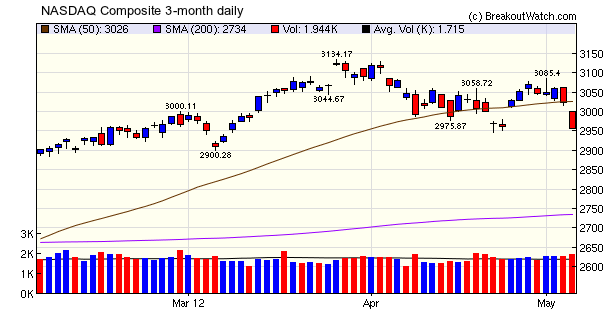
Although our trend indicator for the NASDAQ turned positive on Tuesday, two distribution days and a fall below the 50 day average on Friday are likely harbingers of another reversal to come. If the index holds above the 2950 support level then we may see a trading range between 3050 and 2950 develop.
Sunday is the anniversary of the flash crash and there was an insightful article over at The Big Picture:
" More than $250 billion in long term equity funds has retreated from the markets since May 6th, 2010 – despite a slow but steady improvement in the economy and a stock market that has nearly doubled since the 2009 lows. It isn’t that these investors don’t have confidence in the economy. They don’t have confidence in our markets.
It isn’t hard to blame them. They have witnessed a radical transformation of the best capital allocation market system in the world....." Read More
No new features this week.
Two weeks ago we looked at the question of whether stocks that breakout and then pull back to within 1% of their breakout price within two weeks of initial breakout offered investment potential as compared to normal breakouts. We looked at how they performed within 4 weeks of their pullback and concluded that these stocks did indeed have potential, see (Performance of Breakouts that pull back to Support)
As we pointed out at the time, the analysis was inconclusive as there was no defined entry point for the trade (if you bought on pullback to with 1% of BoP, there was no way of knowing that the stock would not fall further).
We have now defined a hypothetical entry point and can continue our analysis.
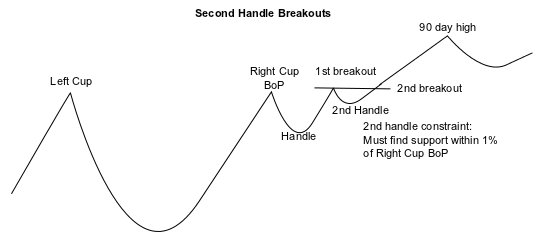
We reason that before pulling back, the stock must have set a new resistance level above the original breakout price, so we will only open a trade if that resistance level is reached again. From this insight, we can develop a new set of position entry rules as follows:
- The stock must pull back to within +/- 1% of the original BoP
within two weeks of breakout. Stocks that fall below -1% of the BoP are
not considered.
- If the high after initial breakout was more than 5% above BoP then do not consider.
- The high after breakout and before pullback represents a new resistance level. We only enter a trade if the intraday price rises to at least that level ) BoP2.
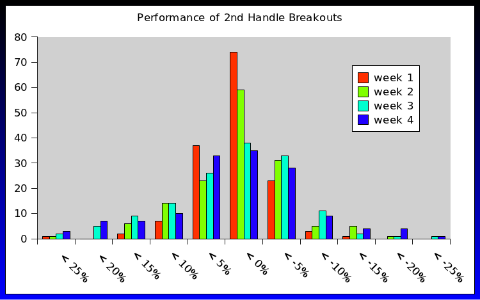
As we can see, the number of positive gains greatly exceeds the negative:
| 2nd Handle Breakouts | ||
| Winners | Losers | |
| Week 1 | 81.8% | 18.2% |
| Week 2 | 71.0% | 29.0% |
| Week 3 | 66.2% | 33.1% |
| Week 4 | 67.4% | 31.9% |
So how do these 2nd handle breakouts compare to initial cup-with-handle breakouts? Now we repeat the analysis for all breakouts since April, 2009, assuming we bought at the initial BoP.
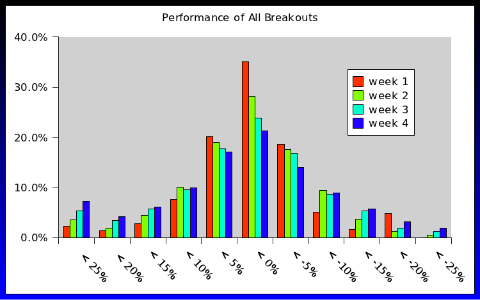
We see that there a lot more negative gains over the four weeks. A winners/losers analysis bears this out:
| Regular CwH Breakouts | ||
| Winners | Losers | |
| Week 1 | 69.7% | 30.3% |
| Week 2 | 67.2% | 32.2% |
| Week 3 | 66.0% | 32.8% |
| Week 4 | 66.1% | 32.0% |
By comparing the two, we see that 2nd
handle breakouts are less risky than regular breakouts. In the first
week, there is only an 18% chance of a losing trade while for regular
breakouts there is a 30% chance that the trade will be a loser. In
other words, by trading second handle breakouts, you reduce your risk
by 40%. However, for less risk there is a corresponding drop in overall
return. We looked at the average gains made by regular breakouts and
2nd handle breakouts in the 90 days after opening a trade and found an
average return for regular breakouts of 20.5% compared to 14.6% for the
second handle breakouts. That is, regular breakouts return 40% more
than 2nd handle breakouts.
Is there a strategy you would like me to analyse? Let me know and I'll have a go at it for you.
| Index | Value | Change Week | Change YTD | Trend | ||||||||||||||||||||||||||||||||||||
|---|---|---|---|---|---|---|---|---|---|---|---|---|---|---|---|---|---|---|---|---|---|---|---|---|---|---|---|---|---|---|---|---|---|---|---|---|---|---|---|---|
| Dow | 13038.3 | -1.44% | 6.72% | Down | ||||||||||||||||||||||||||||||||||||
| NASDAQ | 2956.34 | -3.68% | 13.48% | Up | ||||||||||||||||||||||||||||||||||||
| S&P 500 | 1369.1 | -2.44% | 8.87% | Up | ||||||||||||||||||||||||||||||||||||
| Russell 2000 | 791.84 | -4.07% | 6.87% | Down | ||||||||||||||||||||||||||||||||||||
1The Market Signal is derived from our proprietary
market model. The market model is described on the site. 2The site also shows industry rankings based on fundamentals, combined technical and fundamentals, and on price alone. The site also shows daily industry movements. |
||||||||||||||||||||||||||||||||||||||||
# of Breakouts |
Period Average1 |
Max. Gain During Period2 |
Gain at Period Close3 |
|
|---|---|---|---|---|
| This Week | 13 | 17.77 | 5.49% | -0.05% |
| Last Week | 13 | 22.62 | 4.04% | -3.21% |
| 13 Weeks | 257 | 23.62 | 10.75% |
-1.51% |
2This represents the return if each stock were bought at its breakout price and sold at its intraday high.
3This represents the return if each stock were bought at its breakout price and sold at the most recent close.
Category |
Symbol |
Company Name |
Expected Gain1 |
|---|---|---|---|
| Best Overall | IDSY | I.D. Systems, Inc. | 95 |
| Top Technical | IDSY | I.D. Systems, Inc. | 95 |
| Top Fundamental | QCOR | Questcor Pharmaceuticals, Inc. | 48 |
| Top Tech. & Fund. | QCOR | Questcor Pharmaceuticals, Inc. | 48 |
Category |
Symbol |
Company Name |
Expected Gain1 |
|---|---|---|---|
| Best Overall | PRFT | Perficient, Inc. | 64 |
| Top Technical | MDSO | Medidata Solutions Inc | 37 |
| Top Fundamental | PRFT | Perficient, Inc. | 64 |
| Top Tech. & Fund. | MDSO | Medidata Solutions Inc | 37 |
If you received this newsletter from a friend and you would like to receive it regularly please go to the BreakoutWatch.com site and enter as a Guest. You will then be able to register to receive the newsletter.
Copyright © 2012 NBIcharts, LLC dba BreakoutWatch.com.
All rights reserved.
"
BreakoutWatch," the BreakoutWatch.com "eye" logo, and the
slogan "tomorrow's breakouts today" are service marks of NBIcharts
LLC. All other marks are the property of their respective owners, and are
used for descriptive purposes only.
BreakoutWatch is not affiliated with Investor's Business Daily or with Mr. William O'Neil.
Our site, research and analysis is supported entirely by subscription and is free from advertising.