| Market Summary | Weekly Breakout Report | Top Breakout Choices | Top 2nd Chances | New Features | Tip of the Week |
Subscription
Rates Reduced 33% - see below
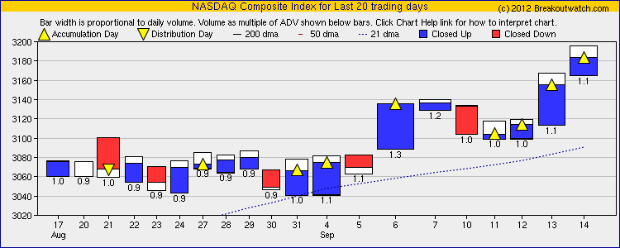
The FOMC delivered the expected QE3 and the markets rejoiced. The NASDAQ Composite broke out on Thursday to a new post 2000 high with an accumulation day volume that was 10% above the 50 day average and turned in another accumulation day on Friday. The rally had been building since Tuesday with successive accumulation days but note that none of them closed at their intraday high indicating there is still some nervousness and some traders want to reap their daily profits rather than let them ride.
Our equivolume charts are an excellent way to assess daily market performance as they simultaneously show price, volume, volume relative to the 50 day average and accumulation and distribution days.
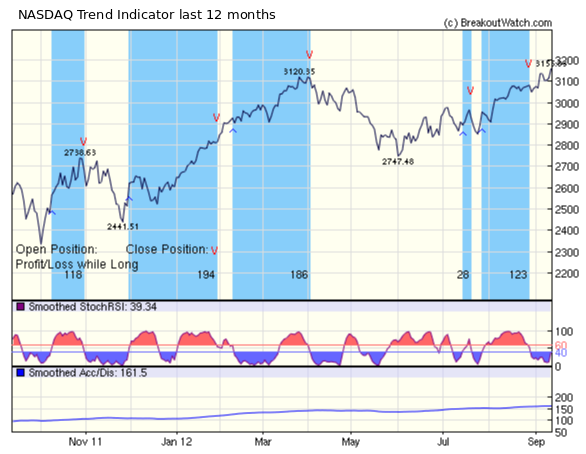
Despite this week's progress, our NASDAQ Trend indicator is still showing down and we discuss the reasons for this below.
The week produced 50 breakouts, with the greatest number coming from the CwH watchlist. The Flat Base pattern was also prominent as could be expected given the range-bounded performance of the lat three weeks. The CwH pattern produced the highest average gain at the week's close and also the highest intraday average. This is consistent with our historical preference for the CwH pattern.
| B'out Date | Symbol | Base | B'Out Price | Last Close | Current % off BOP | *Gain at Intraday High |
| 9/10/2012 | CGI | CwH | 16.9 | 16.65 | −1.48% | 5.62% |
| 9/10/2012 | QUAD | CwH | 18.57 | 19.51 | 5.06% | 7.11% |
| 9/11/2012 | DW | CwH | 29.48 | 29.75 | 0.92% | 0.92% |
| 9/11/2012 | HRS | CwH | 47.55 | 50.52 | 6.25% | 6.25% |
| 9/11/2012 | THO | CwH | 33.19 | 35.85 | 8.01% | 8.01% |
| 9/12/2012 | CX | CwH | 8.15 | 8.37 | 2.70% | 5.03% |
| 9/13/2012 | AREX | CwH | 32.65 | 34.61 | 6.00% | 6.00% |
| 9/13/2012 | BBT | CwH | 32.94 | 33.99 | 3.19% | 3.19% |
| 9/13/2012 | BC | CwH | 24.99 | 25.46 | 1.88% | 1.88% |
| 9/13/2012 | BCOR | CwH | 16.5 | 17.7 | 7.27% | 7.27% |
| 9/13/2012 | BXS | CwH | 15.32 | 15.57 | 1.63% | 1.63% |
| 9/13/2012 | CIA | CwH | 10.27 | 10.78 | 4.97% | 4.97% |
| 9/13/2012 | CSFL | CwH | 8.36 | 8.51 | 1.79% | 2.03% |
| 9/13/2012 | DRN | CwH | 81.06 | 84.84 | 4.66% | 4.66% |
| 9/13/2012 | EGP | CwH | 55.07 | 55.49 | 0.76% | 0.87% |
| 9/13/2012 | ETM | CwH | 6.75 | 7.19 | 6.52% | 6.52% |
| 9/13/2012 | FIO | CwH | 29.46 | 30.15 | 2.34% | 2.34% |
| 9/13/2012 | FTK | CwH | 12.35 | 12.91 | 4.53% | 4.53% |
| 9/13/2012 | GCA | CwH | 7.98 | 8.5 | 6.52% | 6.52% |
| 9/13/2012 | GLDD | CwH | 7.71 | 7.8 | 1.17% | 1.17% |
| 9/13/2012 | HCA | CwH | 29.35 | 31.16 | 6.17% | 6.17% |
| 9/13/2012 | INXN | CwH | 19.94 | 20.17 | 1.15% | 1.15% |
| 9/13/2012 | MHK | CwH | 75.05 | 78.92 | 5.16% | 5.16% |
| 9/13/2012 | NXPI | CwH | 26.04 | 26.67 | 2.42% | 2.42% |
| 9/13/2012 | PIR | CwH | 19.62 | 19.78 | 0.82% | 0.82% |
| 9/13/2012 | PSS | CwH | 21.69 | 21.73 | 0.18% | 0.18% |
| 9/13/2012 | QLD | CwH | 62.18 | 63.37 | 1.91% | 1.91% |
| 9/13/2012 | TBBK | CwH | 9.9 | 10 | 1.01% | 1.01% |
| 9/13/2012 | TQQQ | CwH | 62.74 | 64.45 | 2.73% | 2.73% |
| 9/13/2012 | WFC | CwH | 35 | 36.13 | 3.23% | 3.23% |
| 9/13/2012 | Z | CwH | 43.49 | 42.72 | −1.77% | 1.79% |
| 9/14/2012 | ATU | CwH | 29.93 | 30.09 | 0.53% | 0.53% |
| 9/14/2012 | CSC | CwH | 33.96 | 34.68 | 2.12% | 2.12% |
| 9/14/2012 | ECPG | CwH | 29.82 | 30.04 | 0.74% | 0.74% |
| 9/14/2012 | EXAM | CwH | 13.94 | 14.07 | 0.93% | 0.93% |
| 9/14/2012 | IRIS | CwH | 13.08 | 13.42 | 2.60% | 2.60% |
| 9/14/2012 | PATK | CwH | 13.89 | 14.61 | 5.18% | 5.18% |
| 9/14/2012 | WBC | CwH | 61.71 | 62.1 | 0.63% | 0.63% |
| Average CwH Performance | 2.91% | 3.31% | ||||
| 9/13/2012 | WST | DB | 48.83 | 49.41 | 1.19% | 1.19% |
| 9/11/2012 | BMR | FB | 19.13 | 19.78 | 3.40% | 3.40% |
| 9/11/2012 | V | FB | 131.15 | 134.25 | 2.36% | 2.92% |
| 9/12/2012 | BAX | FB | 59.74 | 60.48 | 1.24% | 1.72% |
| 9/12/2012 | BMR | FB | 19.23 | 19.78 | 2.86% | 2.86% |
| 9/12/2012 | CCG | FB | 11.06 | 11.19 | 1.18% | 1.99% |
| 9/12/2012 | N | FB | 57.95 | 62.86 | 8.47% | 8.47% |
| 9/12/2012 | PGR | FB | 19.9 | 20.81 | 4.57% | 4.57% |
| 9/13/2012 | CAF | FB | 19.05 | 19.36 | 1.63% | 1.63% |
| 9/13/2012 | ICF | FB | 81.39 | 82.32 | 1.14% | 1.14% |
| 9/13/2012 | VNQ | FB | 67.74 | 68.76 | 1.51% | 1.51% |
| 9/14/2012 | SSS | FB | 57.62 | 57.72 | 0.17% | 0.17% |
| Average Flat Base Performance | 2.59% | 2.76% | ||||
33% Subscription Reduction
We have introduced our own QE program with a reduction in subscription rates of 33% across the board, With the Fed's open ended commitment to almost free money, falling dollar prices and low bond yields, there is almost nowhere to invest other than the stock market so equities will inevitably move higher providing an excellent opportunity for nimble swing traders.
Breakoutwatch Trend Module
Successful trend models must avoid the whiplash that results from attempting to identify a change in trend too quickly. Our trend model waits for confirmation that a trend is established so there is always a lag between the market bottom being established (which can only be identified with hindsight) and a change in the trend signal.
Our trend model relies on improving prices, as recognized by a smoothed stochRSI indicator and improving volume as measured by a rising AccDis indicator. The charts shows the NASDAQ closing prices for the last twelve months with the shaded areas representing the periods when the trend was up. You can see the model did pretty well with all 'Profit/Loss while Long' numbers being positive. Below the price chart are the smoothed stochRSI graphs and the AccDis indicator. You can see that the stochRSI is poised to cross the threshold at 40 and that the AccDis is trending up so we should get a trend reversal on Monday if the index makes another new high.
Because of the success of the trend model, we suggest you only go long when the trend is up and consider selling when the trend is down. Our 'Stock Timeliness Checkup' and 'Trend Reversal Signals' tools (under Evaluate > Analytic Tools) can help you with these decisions.
| Index | Value | Change Week | Change YTD | Trend | ||||||||||||||||||||||||||||||||||||
|---|---|---|---|---|---|---|---|---|---|---|---|---|---|---|---|---|---|---|---|---|---|---|---|---|---|---|---|---|---|---|---|---|---|---|---|---|---|---|---|---|
| Dow | 13593.4 | 2.16% | 11.26% | Up | ||||||||||||||||||||||||||||||||||||
| NASDAQ | 3183.95 | 1.52% | 22.22% | Down | ||||||||||||||||||||||||||||||||||||
| S&P 500 | 1465.77 | 1.94% | 16.55% | Up | ||||||||||||||||||||||||||||||||||||
1The Market Signal is derived
from our proprietary market model. The market model is
described on the site.
2The site also shows industry rankings based on fundamentals, combined technical and fundamentals, and on price alone. The site also shows daily industry movements. |
||||||||||||||||||||||||||||||||||||||||
|
# of Breakouts
|
Period Average1
|
Max. Gain During Period2
|
Gain at Period Close3
|
|
|---|---|---|---|---|
| This Week | 51 | 18.77 | 4.32% | 2.76% |
| Last Week | 39 | 15.92 | 7.93% | 5.45% |
| 13 Weeks | 263 | 19.46 | 12.71% |
9.07% |
2This represents the return if each stock were bought at its breakout price and sold at its intraday high.
3This represents the return if each stock were bought at its breakout price and sold at the most recent close.
|
Category
|
Symbol
|
Company Name
|
Expected Gain1
|
|---|---|---|---|
| Best Overall | BXG | Bluegreen Corporation | 120 |
| Top Technical | BXG | Bluegreen Corporation | 120 |
| Top Fundamental | CAMP | CalAmp Corp. | 95 |
| Top Tech. & Fund. | CAMP | CalAmp Corp. | 95 |
|
Category
|
Symbol
|
Company Name
|
Expected Gain1
|
|---|---|---|---|
| Best Overall | TPLM | Triangle Petroleum Corporation | 109 |
| Top Technical | IRIS | IRIS International, Inc. | 62 |
| Top Fundamental | ECPG | Encore Capital Group, Inc. | 51 |
| Top Tech. & Fund. | ECPG | Encore Capital Group, Inc. | 51 |
If you received this newsletter from a friend and you would like to receive it regularly please go to the BreakoutWatch.com site and enter as a Guest. You will then be able to register to receive the newsletter.
Copyright © 2012 NBIcharts, LLC dba BreakoutWatch.com. All rights
reserved.
" BreakoutWatch," the BreakoutWatch.com "eye" logo, and the slogan
"tomorrow's breakouts today" are service marks of NBIcharts LLC.
All other marks are the property of their respective owners, and
are used for descriptive purposes only.
BreakoutWatch is not affiliated with Investor's Business Daily or
with Mr. William O'Neil. Our site, research and analysis is
supported entirely by subscription and is free from advertising.