Breakoutwatch Weekly Newsletter 01/22/16

You are receiving this email because you are or were a BreakoutWatch.com subscriber, or have subscribed to our weekly newsletter. This newsletter summarizes the breakout events of the week and provides additional guidance that does not fit into our daily format. It is published each weekend.

Weekly Commentary

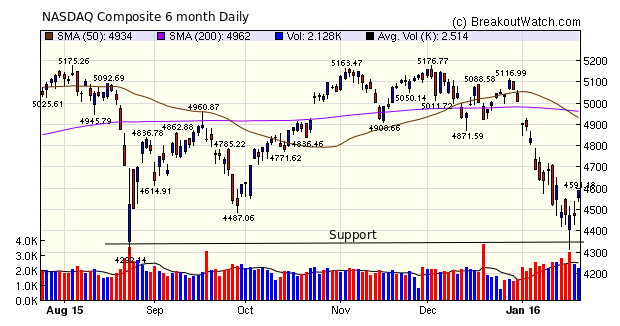
On Wednesday, the NASDAQ Composite found support at Last August's low and closed higher than the day's low, signifying a rally attempt had begun. Thursday's close was higher and Friday's gap up at the open was encouraging and the index closed 2.3% higher for the week,  outperforming the two other major indexes.

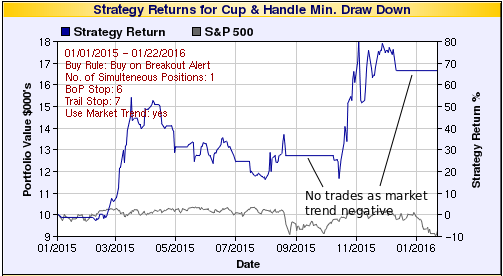
So is the correction, which reached almost 17% for the NASDAQ, over? Investors Business Daily advises to wait for a "follow through  day" (FTD) which could occur as early as Monday, although my analysis of the success of FTD's (see Are Follow Through Days a Reliable Indicator of Downward Trend Reversal?) concluded they were not reliable, confirming only two out of six actual rallys studied. Following that study, I developed my own trend reversal signal, which continues to indicate a downward trend.

As for the longer term outlook, Nouriel  Roubini, who was one of the few economists to warn of the 2008 crash, is moderately upbeat about the prospects for the global economy this  year.

NASDAQ Comp. Chart
Weekly Breakout Report

Breakouts Summary by Watchlist for Week Beginning 01/18/16
List Breakouts Avg. Gain
CwH 3 1.88
SQZ 9 3.08
HSB 1 10.73
Breakouts Detail for Week Beginning 01/18/16
Brkout Date Symbol Base Squeeze BrkoutOut Price Brkout Day Close RS Rank* Last Close Current % off BOP Gain at Intraday High
01/20/16 GCO HSB N 56.64 61.38 46 62.72 10.73 10.93
01/20/16 ADTN SQZ Y 17.62 17.94 94 18.835 6.90 7.63
01/21/16 PETS SQZ Y 17.42 17.96 91 18.62 6.89 7.58
01/21/16 ADTN SQZ Y 17.95 18.965 90 18.835 4.93 5.65
01/21/16 NNN CwH N 40.50 40.53 83 41.63 2.79 2.81
01/21/16 DF CwH N 18.40 18.64 85 18.9 2.72 2.77
01/22/16 NNN SQZ Y 40.54 41.63 87 41.63 2.69 2.71
01/22/16 UTL SQZ Y 35.76 36.58 82 36.58 2.29 2.32
01/22/16 EEFT SQZ Y 72.40 73.57 95 73.57 1.62 1.71
01/22/16 T SQZ Y 34.59 35.09 88 35.09 1.45 1.59
01/21/16 PLKI SQZ Y 59.16 60.01 83 59.48 0.54 1.52
01/22/16 FDEF SQZ Y 37.49 37.63 88 37.63 0.37 0.37
01/22/16 GBAB CwH N 22.37 22.40 89 22.4 0.13 0.27
Weekly Average (13 breakouts) 3.39 3.68
*RS Rank on day before breakout.
New Features This Week

No new features this week, although the cup and handle backtest, which was withdrawn from service, is  back on line.
 
Top Tip of the Week

New Rules for Trading Cup and Handle Breakouts


I discovered a bug in the cup and handle backtest which caused it to produce more optimistic  profit results than were in fact possible. Consequently, I withdrew the tool from service while I corrected and tested the bug. The tool is now back on line. The default settings are for the optimal returns as described below.

Since January 1, 2015 to yesterday (1/22/16), the strategy could have returned 66% compared to a loss of 7.5% for the S&P 500.

Revised Strategy Returns

The corrected tool now leads me to suggest new rules for trading cup and handle pattern breakouts for optimal (meaning best return at lowest risk) returns. The new rules are:
  • Each day, before the market opens, create a list of cup and handle pattern stocks that satisfy these conditions
    • RS Rank must be at least 92
    • Industry Rank must be in the top 50 percentile (i.e. have a rank less than 111 in our industry ranking scheme
    • Average daily volume >= 100,000.
    • Positive Quarterly Earnings score >= 6/10 (CEF2)
    • Quarterly Earnings Growth Acceleration score >= 2/10 (CEF3)
  • You can create this list of stocks using the filter settings shown below.
  • Check the market trends published each day on our Monitor > Market Analysis page or in our daily email
  • If market trend is positive, buy on alerts meeting these criteria with a stop limit 5% above the breakout price (BoP)
  • Sell at next open if closing price less than BoP or volume at end of breakout day is less than 1.25 times average 50 day volume
  • Monitor the closing price each day and set a trailing stop at 7% below the highest close since breakout.
  • Sell if trailing stop met intraday.
These filter setting on the cup and handle watchlist will select stocks meeting these criteria and also set your alerts to include these stocks:

Revised CwH Filters
Major Index Summary
Index Value Change Week Change YTD Trend1
Dow 16093.5
0.66% -7.64% Down
NASDAQ 4591.18
2.29% -8.31% Down
S&P 500 1906.9
1.41% -6.7% Down
1The Market Trend is derived from our proprietary market model. The market model is described on the site.
2The site also shows industry rankings based on fundamentals, combined technical and fundamentals, and on price alone. The site also shows daily industry movements.
Best Performing Index
1 Week 13 Weeks 26 Weeks Year-to-Date
NASDAQ Composite
2.29 %
S&P 500
-8.11 %
S&P 500
-8.31 %
S&P 500
-6.7 %
Best Performing Industry (by average technical score over each period)
1 Week 3 Weeks 13 Weeks 26 Weeks
Regional - Northeast Banks Regional - Mid-Atlantic Banks Auto Parts Stores Cigarettes
Most Improved Industry (by change in technical rank2)
Publishing - Newspapers
+ 46
Drug Related Products
+ 97
Research Services
+ 171
Publishing - Newspapers
+ 145
Charts of each industry rank and performance over 12 months are available on the site
Top Breakout Choices: Stocks on our Cup-and-Handle list with best expected gain if they breakout
Category
Symbol
Company Name
Expected Gain1
Best Overall CLCD
CoLucid Pharmaceuticals, Inc.
95
Top Technical CLCD
CoLucid Pharmaceuticals, Inc.
95
Top Fundamental QIHU
Qihoo 360 Technology Co. Ltd.
42
Top Tech. & Fund. QIHU
Qihoo 360 Technology Co. Ltd.
42
1This is the gain predicted by our Expected Gain model within 6 months of breakout which uses the volume on breakout as a predictive term. Because the model variance is +/- 38% the expectation can be negative.
Top Second Chances: Stocks that broke out this week and are still in buyable range
Category
Symbol
Company Name
Expected Gain1
Best Overall DF
Dean Foods Company
42
Top Technical NNN
National Retail Properties
21
Top Fundamental NNN
National Retail Properties
21
Top Tech. & Fund. NNN
National Retail Properties
21
1This is the gain predicted by our Expected Gain model within 6 months of breakout which uses the volume on breakout as a predictive term. Because the model variance is +/- 38% the expectation can be negative.

If you received this newsletter from a friend and you would like to receive it regularly please go to the BreakoutWatch.com site and enter as a Guest. You will then be able to register to receive the newsletter.

Copyright (c) 01/22/2016 NBIcharts, LLC dba BreakoutWatch.com. All rights reserved.
" BreakoutWatch," the BreakoutWatch.com "eye" logo, and the slogan "tomorrow's breakouts today" are service marks of NBIcharts LLC. All other marks are the property of their respective owners, and are used for descriptive purposes only.

BreakoutWatch is not affiliated with Investor's Business Daily or with Mr. William O'Neil. Our site, research and analysis is supported entirely by subscription and is free from advertising.