Breakoutwatch Weekly Summary 01/06/18
You are receiving this email because you are or were a BreakoutWatch.com subscriber, or have subscribed to our weekly newsletter. This newsletter summarizes the breakout events of the week and provides additional guidance that does not fit into our daily format. It is published each weekend.
| New Breakout Prediction Model, New
Trading Suggestions and New Breakout Criteria See Strategy Suggestions below for important new insights. The NASDAQ celebrated the New Year with 4 days of consecutive new highs and strong accumulation to rise 3.4% for the week. It would be surprising if this level of euphoria would continue, so some consolidation is likely in the week ahead. 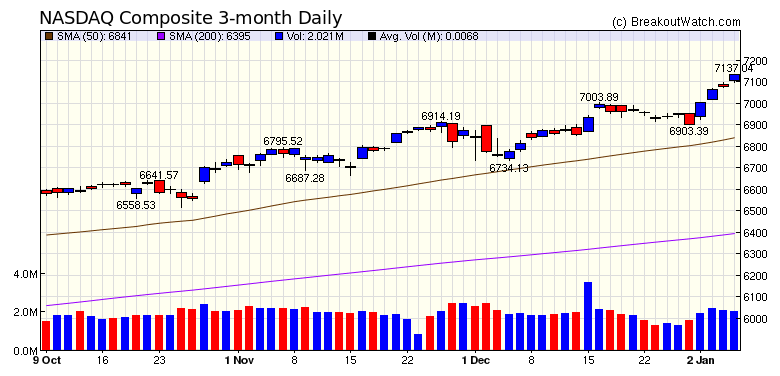 |
| New Breakout Criteria Based on the research I did over the break, I have decided to lower the volume threshold for declaring a breakout for all long position watchlists to the 50 day average volume level. That is a breakout will be counted as such if the volume exceeds the 50 day average and the price closes above the breakout price. For Cup and Handle, Double Bottom and Head and Shoulders patterns this is now consistent with the breakout criteria for High Tight Flag and Volatility Squeeze patterns. Consequently, there are many more cup and handle breakouts now as seen below. New Breakout Prediction Indicator for the Cup and Handle watchlist  A new column "Pred. Brkout" was added to the Cup and Handle Watchlist to indicate if a breakout is predicted. If it is predicted a "Y" will appear in this column. See my notes on the Breakout Prediction metric Less than a hundred stocks in any year will meet the criteria for this metric, so a "Y" in this column will be rare. To sort the column, click on the up/down arrows next to the column heading New Filter Setting You can now filter the watchlist for stocks meeting the "Y" criteria. |
|
I followed the work I did to develop the Breakout Prediction metric, with an analysis of the criteria that would have led to the best trading results in 2017. This has resulted in new suggestions for "Buying on Alert" or "Buying at the Next Open". These are described here. As long as the current market trend continues, these suggestions should be quite profitable. A notable feature of the recent trend has been low volatility and so a tighter trailing stop can be used as shown in the suggestions. |
| List | Breakouts | Avg. Gain |
|---|---|---|
| CWH | 21 | 0.44 |
| SQZ | 8 | 3.84 |
| HTF | 5 | 3.64 |
| HSB | 0 | |
| DB | 1 | 4.21 |
| Brkout Date | Symbol | Base | Squeeze | BrkoutOut Price | Brkout Day Close | RS Rank* | Last Close | Current % off BOP | Gain at Intraday High |
|---|---|---|---|---|---|---|---|---|---|
| 2018-01-05 | IO | HTF | n | 20.54 | 23 | 99 | 22.95 | 11.73% | 13.19% |
| 2018-01-02 | VNET | CWH | n | 8.23 | 8 | 91 | 9.16 | 11.3% | 14.46% |
| 2018-01-02 | WUBA | SQZ | y | 71.58 | 76 | 95 | 79.57 | 11.16% | 13.38% |
| 2018-01-03 | TEAM | SQZ | y | 47.07 | 50 | 92 | 51.87 | 10.2% | 11.39% |
| 2018-01-03 | GLMD | CWH | n | 9.78 | 10 | 95 | 10.7 | 9.41% | 9.41% |
| 2018-01-03 | VRX | HTF | n | 22.81 | 23 | 93 | 23.85 | 4.56% | 7.1% |
| 2018-01-02 | SILC | DB | y | 71.99 | 75 | 92 | 75.02 | 4.21% | 8.28% |
| 2018-01-04 | CNHI | CWH | n | 13.64 | 14 | 85 | 14.05 | 3.01% | 3.52% |
| 2018-01-04 | TEAM | SQZ | y | 50.41 | 52 | 94 | 51.87 | 2.9% | 4.01% |
| 2018-01-03 | CH | CWH | n | 9.13 | 9 | 84 | 9.36 | 2.52% | 2.96% |
| 2018-01-04 | HDNG | SQZ | y | 17.34 | 17 | 88 | 17.76 | 2.42% | 3.52% |
| 2018-01-03 | FMC | CWH | n | 96.02 | 97 | 87 | 98.08 | 2.15% | 2.78% |
| 2018-01-05 | OSTK | HTF | n | 82.70 | 84 | 99 | 84.35 | 2% | 4.66% |
| 2018-01-04 | QDEL | CWH | n | 46.14 | 46 | 94 | 46.89 | 1.63% | 3.16% |
| 2018-01-02 | UCTT | SQZ | y | 23.10 | 24 | 87 | 23.44 | 1.47% | 6.36% |
| 2018-01-02 | IXYS | SQZ | y | 23.96 | 24 | 91 | 24.3 | 1.42% | 2.25% |
| 2018-01-02 | PRGS | CWH | n | 43.12 | 43 | 86 | 43.61 | 1.14% | 1.76% |
| 2018-01-03 | CHGG | CWH | n | 16.67 | 17 | 94 | 16.79 | 0.72% | 2.22% |
| 2018-01-03 | SILC | SQZ | y | 74.57 | 77 | 93 | 75.02 | 0.6% | 4.53% |
| 2018-01-03 | CRESY | SQZ | y | 22.35 | 22 | 80 | 22.48 | 0.58% | 1.57% |
| 2018-01-03 | SBLK | CWH | y | 12.14 | 12 | 90 | 12.2 | 0.49% | 4.94% |
| 2018-01-05 | CVCO | CWH | n | 156.50 | 157 | 81 | 156.85 | 0.22% | 0.38% |
| 2018-01-05 | BR | CWH | n | 92.44 | 93 | 83 | 92.56 | 0.13% | 0.23% |
| 2018-01-05 | CKH | HTF | n | 49.15 | 49 | 83 | 49.15 | 0% | 0.08% |
| 2018-01-04 | BETR | HTF | n | 12.15 | 12 | 92 | 12.14 | -0.08% | 1.32% |
| 2018-01-04 | GNK | CWH | n | 13.92 | 14 | 87 | 13.87 | -0.36% | 3.02% |
| 2018-01-04 | KFRC | CWH | n | 26.75 | 27 | 80 | 26.65 | -0.37% | 1.12% |
| 2018-01-04 | CARB | CWH | n | 25.80 | 26 | 84 | 25.6 | -0.78% | 0.58% |
| 2018-01-04 | CBAY | CWH | n | 9.79 | 10 | 98 | 9.69 | -1.02% | 4.7% |
| 2018-01-03 | CTLT | CWH | n | 42.22 | 42 | 83 | 41.66 | -1.33% | 0.81% |
| 2018-01-04 | MXIM | CWH | n | 54.07 | 54 | 80 | 53.34 | -1.35% | 0.96% |
| 2018-01-02 | XENT | CWH | n | 34.40 | 35 | 94 | 33.85 | -1.6% | 2.03% |
| 2018-01-03 | NTGR | CWH | n | 61.35 | 62 | 82 | 59.55 | -2.93% | 0.98% |
| 2018-01-02 | SRPT | CWH | y | 57.31 | 58 | 95 | 54.87 | -4.26% | 4.61% |
| 2018-01-02 | LE | CWH | n | 20.35 | 20 | 87 | 18.4 | -9.58% | 2.06% |
| *RS Rank on day before breakout. | |||||||||
| Symbol | BO Price |
BO Vol. |
Company | Industry | RS Rank |
Last Close |
|---|---|---|---|---|---|---|
| CYRX | 9.15 | 169,658 | CryoPort - Inc. - Common Stock | Packaging & Containers | 97 | 8.45 |
| WTW | 52.07 | 2,142,432 | Weight Watchers International Inc Weight Watchers | Personal Services | 97 | 46.91 |
| PETS | 49.04 | 831,672 | PetMed Express - Inc. - Common Stock | Drug Delivery | 95 | 48.33 |
| These stocks meet our suggested screening factors
for our Cup and Handle Chart Pattern watchlist. See Revised Rules for Trading Cup and Handle Breakouts |
||||||
| Index | Value | Change Week | Change YTD | Trend1 |
|---|---|---|---|---|
| Dow | 25295.9 |
2.33% | 2.33% | Up |
| NASDAQ | 7136.56 |
3.38% | 3.38% | Up |
| S&P 500 | 2743.15 |
2.6% | 2.6% | Up |
|
1The Market Trend is derived from
our proprietary market model. The market model is described on
the site here.
2The site also shows industry rankings based on fundamentals, combined technical and fundamentals, and on price alone. The site also shows daily industry movements. |
||||
| 1 Week | 13 Weeks | 26 Weeks | Year-to-Date |
|---|---|---|---|
| NASDAQ Composite |
Dow Jones 11.08 % |
Dow Jones 18.13 % |
NASDAQ Composite 3.38 % |
| 1 Week | 3 Weeks | 13 Weeks | 26 Weeks |
|---|---|---|---|
| Auto Parts Wholesale |
Auto Parts Wholesale |
Auto Parts Wholesale |
Aluminum |
| Auto Parts Stores 86 |
Auto Parts Stores 83 |
Publishing - Books 147 |
Wholesale - Other 215 |
| Charts of each industry rank and performance over 12 months are available on the site | |||
If you received this newsletter from a friend and you would like to receive it regularly please go to the BreakoutWatch.com site and you will then be able to register to receive the newsletter.
Copyright (c) 01/06/2018 NBIcharts, LLC dba BreakoutWatch.com. All
rights reserved.
" BreakoutWatch," the BreakoutWatch.com "eye" logo, and the slogan
"tomorrow's breakouts today" are service marks of NBIcharts LLC. All
other marks are the property of their respective owners, and are used
for descriptive purposes only.
BreakoutWatch is not affiliated with Investor's Business Daily or with Mr. William O'Neil. Our site, research and analysis is supported entirely by subscription and is free from advertising.