Breakoutwatch Weekly Summary 03/24/18
You are receiving this email because you are or were a BreakoutWatch.com subscriber, or have subscribed to our weekly newsletter. This newsletter summarizes the breakout events of the week and provides additional guidance that does not fit into our daily format. It is published each weekend.
| Market Trend Signals Turn Negative Rocked by trade tariffs, Facebook revelations, an interest rate hike by the Fed and apparant chaos in the White House, the major indexes dropped sharply again this week.The trend signals for the DJI and S&P 500 turned negative on Wednesday and the NASDAQ followed suit on Thursday. Tech stocks were the biggest sufferers and the the NASDAQ led the indexes with a 6.54% loss. The rate of losses on the NASDAQ accelerated from Wednesday as declines increased and so did volumes. Losses have not yet reached their early February levels but support could be tested at 6630. With steel and aluminum tariff policy announcements causing concern and then being moderated it is difficult to know if the new China tarrifs are just a negotiating gambit also. A more hawkish foreign policy could also continue to upset the markets. Breakouts were overall left in negative territory although some made significant gains. Despite the possibility that some stocks will do well, even in a downward trending market, the level of risk has increased substantially. 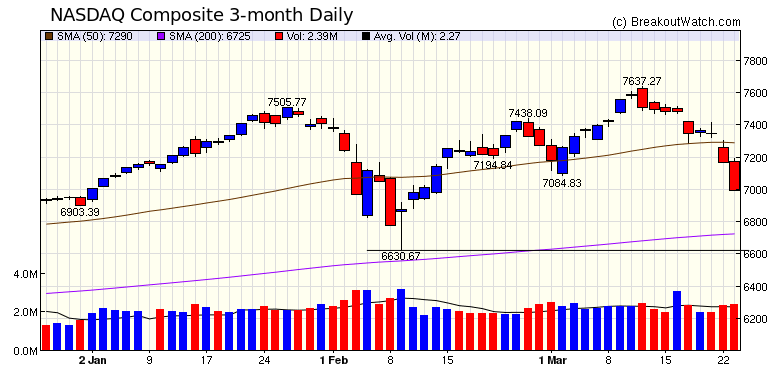 |
Sell Strategy Added to
Cup-and-Handle Backtest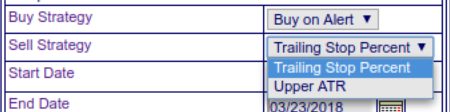 Following on from the
introduction last week of the Trailing
Stop Calculator tool I've added an option the CwH backtest
tool to allow backtesting using eirthr a fixed trailing stop
percentage or to use the upper Average Trading Range band as the
trailing stop. In a volatile market, this seems to provide a
better result as it takes the guesswork out of deciding what
trailing stop percentage to use. As shown in the image to the
right, you can choose a Sell Strategy of "Trailing Stop Percent"
or "Upper ATR". Following on from the
introduction last week of the Trailing
Stop Calculator tool I've added an option the CwH backtest
tool to allow backtesting using eirthr a fixed trailing stop
percentage or to use the upper Average Trading Range band as the
trailing stop. In a volatile market, this seems to provide a
better result as it takes the guesswork out of deciding what
trailing stop percentage to use. As shown in the image to the
right, you can choose a Sell Strategy of "Trailing Stop Percent"
or "Upper ATR". |
Use Average True Range to Improve ProfitsIntroductionDuring 2017, the daily trading range of the S&P 500 was around 2%. I found, through back testing of the cup-and-handle breakout stocks, that a trailing stop of 3% gave very good average returns during that time. However, now that volatility has increased sharply, a 3% trailing stop is likely to cause one to exit a position too soon and be sub-optimal as the stock could quickly rise again and what could have been a winning position has been turned into a losing one. Which leads to the question of what trailing stop value is appropriate in 2018? Volatility, as the term implies, waxes and wanes. It not only applies to the major indexes but also to individual stocks. The optimum trailing stop value during high volatility will be looser than during a period of low volatility, and what is appropriate for one stock that is experiencing high volatility will not be optimum for another experiencing low volatility. What we need is a method for calculating a trailing stop value suitable to the volatility of each individual stock. I am proposing that the Average True Range indicator could be the tool we need. Average True RangeThe true range concept was introduced by commodities trader Welles Wilder. I wont describe the calculation here as you can read about it in Wikipedia. The Average True Range (ATR) is a moving average calculated over 'n' days. For our calculation we are using n=14 days, although I may change that if I find a shorter period gives better results. I have added an ATR band to our technical charting tool. It is explained in this newsletter. Here's an example of applying the ATR band to Whiting Petroleum Corporation (WLL) which broke out on 3/21/2018. If we were to use the upper ATR band as a trailing stop for the next day's trading (3/26/18) then we use a value of 32.14 which is the value of the upper ATR band on 3/23/18. 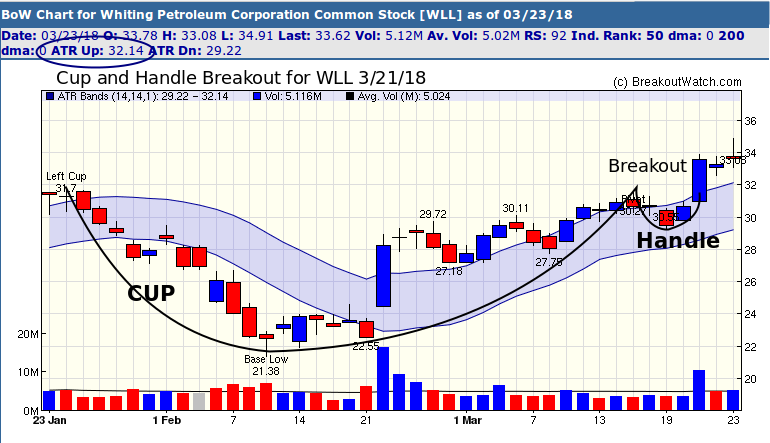 |

| List | Breakouts | Avg. Gain |
|---|---|---|
| CWH | 41 | -3.66 |
| SQZ | 49 | -1.1 |
| HTF | 0 | |
| HSB | 0 | |
| DB | 6 | -2.92 |
| Brkout Date | Symbol | Base | Squeeze | BrkoutOut Price | Brkout Day Close | RS Rank* | Last Close | Current % off BOP | Gain at Intraday High |
|---|---|---|---|---|---|---|---|---|---|
| 2018-03-19 | GPRK | SQZ | y | 10.22 | 10.83 | 86 | 12.08 | 18.2% | 16.05% |
| 2018-03-20 | GPRK | SQZ | y | 10.84 | 11.5 | 90 | 12.08 | 11.44% | 9.41% |
| 2018-03-20 | WLL | CWH | n | 30.27 | 30.66 | 82 | 33.62 | 11.07% | 9.28% |
| 2018-03-20 | DVAX | SQZ | y | 16.71 | 17.45 | 94 | 18.5 | 10.71% | 10.59% |
| 2018-03-20 | SRI | CWH | n | 25.04 | 28.79 | 87 | 26.89 | 7.39% | 13.82% |
| 2018-03-19 | ZUMZ | SQZ | y | 22.11 | 23.4 | 87 | 23.55 | 6.51% | 6.78% |
| 2018-03-21 | DVAX | SQZ | y | 17.46 | 18.4 | 94 | 18.5 | 5.96% | 5.84% |
| 2018-03-20 | QDEL | CWH | n | 49.63 | 49.8 | 94 | 51.03 | 2.82% | -0.22% |
| 2018-03-21 | EC | SQZ | y | 18.56 | 19.38 | 96 | 19.06 | 2.69% | 0.11% |
| 2018-03-20 | MPC | CWH | n | 69.43 | 71.46 | 83 | 71.28 | 2.66% | 3.86% |
| 2018-03-20 | MOMO | CWH | n | 37.98 | 38.76 | 80 | 38.9 | 2.42% | 1.08% |
| 2018-03-19 | TGLS | SQZ | y | 9.40 | 9.54 | 81 | 9.56 | 1.7% | 1.49% |
| 2018-03-21 | STO | SQZ | y | 23.08 | 23.7 | 84 | 23.33 | 1.08% | 0.3% |
| 2018-03-22 | SPSC | CWH | n | 64.20 | 64.65 | 80 | 64.65 | 0.7% | -1.85% |
| 2018-03-19 | ECHO | SQZ | y | 27.56 | 27.6 | 85 | 27.7 | 0.51% | -0.11% |
| 2018-03-22 | DVAX | SQZ | y | 18.41 | 18.5 | 95 | 18.5 | 0.49% | 0.38% |
| 2018-03-21 | RLH | SQZ | y | 10.01 | 10.25 | 87 | 10.05 | 0.4% | 2.4% |
| 2018-03-20 | ECHO | SQZ | y | 27.61 | 27.65 | 85 | 27.7 | 0.33% | -0.29% |
| 2018-03-19 | DPS | SQZ | y | 117.61 | 118.36 | 85 | 117.95 | 0.29% | 0.11% |
| 2018-03-20 | EBS | CWH | n | 52.84 | 53.75 | 92 | 52.95 | 0.21% | 1.72% |
| 2018-03-21 | TDG | DB | n | 302.22 | 309.34 | 83 | 302.8 | 0.19% | 1.51% |
| 2018-03-19 | TDG | DB | y | 302.22 | 302.5 | 78 | 302.8 | 0.19% | 1.51% |
| 2018-03-20 | TDG | DB | n | 302.22 | 308.14 | 80 | 302.8 | 0.19% | 1.51% |
| 2018-03-21 | ECHO | SQZ | y | 27.66 | 28.05 | 85 | 27.7 | 0.14% | -0.47% |
| 2018-03-23 | FANG | SQZ | y | 127.79 | 127.96 | 84 | 127.96 | 0.13% | -0.13% |
| 2018-03-19 | DST | SQZ | y | 83.42 | 83.57 | 92 | 83.3 | -0.14% | -0% |
| 2018-03-22 | MOV | SQZ | y | 32.06 | 32.25 | 80 | 31.95 | -0.34% | -0.5% |
| 2018-03-20 | DPS | SQZ | y | 118.37 | 118.4 | 86 | 117.95 | -0.35% | -0.53% |
| 2018-03-20 | NRT | SQZ | y | 8.42 | 8.54 | 88 | 8.39 | -0.36% | -1.07% |
| 2018-03-20 | SUPN | CWH | n | 44.62 | 45.35 | 84 | 44.45 | -0.38% | -1.52% |
| 2018-03-21 | IIN | SQZ | y | 19.61 | 20.05 | 96 | 19.5 | -0.56% | -1.84% |
| 2018-03-19 | BBX | CWH | n | 9.21 | 9.22 | 85 | 9.15 | -0.65% | -0.11% |
| 2018-03-19 | ENTG | CWH | n | 36.25 | 36.5 | 89 | 35.85 | -1.1% | 1.24% |
| 2018-03-22 | ECHO | SQZ | y | 28.06 | 28.3 | 87 | 27.7 | -1.28% | -1.89% |
| 2018-03-21 | FOXA | SQZ | y | 36.70 | 36.86 | 82 | 36.12 | -1.58% | -0.27% |
| 2018-03-20 | SSNC | CWH | n | 52.49 | 52.68 | 90 | 51.55 | -1.79% | -0.08% |
| 2018-03-20 | RFP | SQZ | y | 8.51 | 8.65 | 92 | 8.35 | -1.88% | 2.82% |
| 2018-03-19 | VNET | SQZ | y | 7.85 | 8.05 | 84 | 7.69 | -2.04% | -0.25% |
| 2018-03-22 | RLH | SQZ | y | 10.26 | 10.3 | 87 | 10.05 | -2.05% | -0.1% |
| 2018-03-21 | BAP | SQZ | y | 222.40 | 223.48 | 80 | 217.72 | -2.1% | -2.43% |
| 2018-03-21 | WOOD | CWH | n | 78.25 | 78.97 | 82 | 76.45 | -2.3% | 0.17% |
| 2018-03-22 | TREX | SQZ | y | 110.82 | 111.41 | 88 | 108.25 | -2.32% | -0.76% |
| 2018-03-21 | ICFI | CWH | n | 61.25 | 61.4 | 86 | 59.75 | -2.45% | -0.49% |
| 2018-03-21 | NUS | CWH | y | 73.72 | 74.35 | 81 | 71.84 | -2.55% | -0.91% |
| 2018-03-19 | ODFL | CWH | n | 147.53 | 147.87 | 91 | 143.74 | -2.57% | 1.1% |
| 2018-03-21 | BCH | SQZ | y | 101.39 | 101.42 | 81 | 98.75 | -2.6% | -0.84% |
| 2018-03-21 | DATA | SQZ | y | 83.60 | 84.1 | 88 | 81.41 | -2.62% | -0.41% |
| 2018-03-19 | FAF | SQZ | y | 59.47 | 60.32 | 84 | 57.8 | -2.81% | 1.09% |
| 2018-03-21 | CEO | DB | n | 150.79 | 152.86 | 82 | 145.74 | -3.35% | -1.45% |
| 2018-03-19 | BKI | SQZ | y | 48.71 | 48.8 | 99 | 47.05 | -3.41% | -0.74% |
| 2018-03-21 | VLO | SQZ | y | 94.48 | 95.45 | 85 | 91.22 | -3.45% | 0.01% |
| 2018-03-21 | BOOM | CWH | n | 27.25 | 27.55 | 96 | 26.3 | -3.49% | -1.65% |
| 2018-03-19 | TDY | SQZ | y | 190.56 | 190.69 | 83 | 183.89 | -3.5% | 0.2% |
| 2018-03-20 | RICK | SQZ | y | 28.56 | 28.93 | 84 | 27.56 | -3.5% | -0% |
| 2018-03-20 | TDY | SQZ | y | 190.70 | 192.5 | 84 | 183.89 | -3.57% | 0.13% |
| 2018-03-20 | PCTY | CWH | n | 54.13 | 54.82 | 80 | 52.18 | -3.6% | 1.33% |
| 2018-03-21 | TRU | SQZ | y | 59.17 | 59.21 | 86 | 57.01 | -3.65% | -0.27% |
| 2018-03-21 | CUB | CWH | n | 65.20 | 65.5 | 84 | 62.8 | -3.68% | -0.61% |
| 2018-03-19 | TBBK | SQZ | y | 11.00 | 11.17 | 93 | 10.59 | -3.73% | 0.73% |
| 2018-03-21 | GNK | CWH | n | 15.25 | 15.51 | 86 | 14.67 | -3.8% | -0.85% |
| 2018-03-20 | NVMI | SQZ | y | 28.50 | 28.9 | 82 | 27.41 | -3.82% | 0.98% |
| 2018-03-20 | CNCE | SQZ | y | 23.22 | 23.28 | 85 | 22.32 | -3.88% | -0.73% |
| 2018-03-21 | PJT | SQZ | y | 49.60 | 49.85 | 84 | 47.67 | -3.89% | -1.07% |
| 2018-03-19 | RCKY | CWH | n | 21.70 | 21.95 | 93 | 20.85 | -3.92% | -1.61% |
| 2018-03-21 | FLR | SQZ | y | 57.19 | 58.3 | 82 | 54.85 | -4.09% | -0.23% |
| 2018-03-21 | ON | CWH | n | 26.30 | 26.5 | 93 | 25.04 | -4.79% | -1.14% |
| 2018-03-20 | FLT | CWH | n | 208.24 | 208.29 | 85 | 198.23 | -4.81% | 0.06% |
| 2018-03-21 | FLT | SQZ | y | 208.30 | 208.64 | 86 | 198.23 | -4.83% | 0.03% |
| 2018-03-20 | V | SQZ | y | 123.22 | 124.91 | 82 | 117 | -5.05% | 0.06% |
| 2018-03-20 | TBBK | SQZ | y | 11.18 | 11.19 | 93 | 10.59 | -5.28% | -0.89% |
| 2018-03-21 | PFBC | CWH | n | 66.18 | 66.26 | 80 | 62.68 | -5.29% | -0.76% |
| 2018-03-22 | CNCE | SQZ | y | 23.61 | 23.84 | 88 | 22.32 | -5.46% | -2.37% |
| 2018-03-20 | SEIC | CWH | n | 76.89 | 77.11 | 86 | 72.61 | -5.57% | 0.14% |
| 2018-03-20 | HDP | CWH | n | 20.58 | 20.66 | 89 | 19.43 | -5.59% | -1.02% |
| 2018-03-20 | PGJ | CWH | n | 49.80 | 49.83 | 82 | 46.93 | -5.76% | -0.24% |
| 2018-03-21 | IDTI | CWH | n | 32.77 | 33.21 | 80 | 30.8 | -6.01% | -0.73% |
| 2018-03-21 | ASML | CWH | n | 212.75 | 213.73 | 92 | 199.11 | -6.41% | -0.19% |
| 2018-03-21 | URI | CWH | n | 186.11 | 187.27 | 91 | 174.18 | -6.41% | -0.86% |
| 2018-03-21 | OSBC | CWH | n | 14.70 | 14.75 | 81 | 13.75 | -6.46% | -2.38% |
| 2018-03-21 | KELYA | CWH | n | 30.71 | 30.91 | 84 | 28.68 | -6.61% | -1.5% |
| 2018-03-21 | XLRN | SQZ | y | 42.21 | 43.53 | 84 | 39.39 | -6.68% | -2.46% |
| 2018-03-20 | EDU | DB | y | 96.73 | 97.04 | 82 | 89.92 | -7.04% | -2.41% |
| 2018-03-20 | PATK | SQZ | y | 66.16 | 67.35 | 81 | 61.5 | -7.04% | -0.39% |
| 2018-03-21 | STM | CWH | n | 24.43 | 24.97 | 89 | 22.66 | -7.25% | 1.23% |
| 2018-03-21 | TER | CWH | n | 49.27 | 49.5 | 90 | 45.65 | -7.35% | -0.45% |
| 2018-03-19 | HLI | SQZ | y | 47.42 | 47.46 | 83 | 43.88 | -7.47% | -0.55% |
| 2018-03-20 | MPWR | CWH | n | 124.27 | 125.11 | 80 | 114.89 | -7.55% | -0.21% |
| 2018-03-21 | ETFC | CWH | n | 57.45 | 57.61 | 91 | 53.09 | -7.59% | -0.68% |
| 2018-03-21 | KEM | CWH | n | 19.70 | 19.97 | 88 | 18.2 | -7.61% | -0.3% |
| 2018-03-21 | MPWR | DB | n | 124.44 | 125.39 | 82 | 114.89 | -7.67% | -0.35% |
| 2018-03-19 | TTOO | CWH | n | 6.84 | 6.91 | 95 | 6.31 | -7.75% | -3.51% |
| 2018-03-19 | INBK | CWH | y | 38.86 | 39.35 | 80 | 35.75 | -8% | -1.31% |
| 2018-03-20 | MNTA | CWH | n | 18.30 | 18.4 | 86 | 16.75 | -8.47% | -0.44% |
| 2018-03-21 | KBSF | SQZ | y | 6.59 | 6.64 | 97 | 6 | -8.95% | -1.21% |
| 2018-03-21 | LRCX | CWH | n | 223.00 | 224.28 | 90 | 202.63 | -9.13% | -0.86% |
| 2018-03-20 | HALO | CWH | n | 20.85 | 21.2 | 86 | 18.59 | -10.84% | 0.24% |
| *RS Rank on day before breakout. | |||||||||
| Symbol | BO Price |
BO Vol. |
Company | Industry | RS Rank |
Last Close |
|---|---|---|---|---|---|---|
| ATHM | 88.51 | 1,359,099 | Autohome Inc. American Depositary Shares - each rep | Internet Information Providers | 96 | 85.29 |
| BOOM | 27.25 | 109,012 | DMC Global Inc. - Common Stock | Metal Fabrication | 96 | 26.30 |
| VHI | 6.63 | 238,172 | Valhi - Inc. Common Stock | Chemicals - Major Diversified | 96 | 6.27 |
| CUTR | 53.30 | 249,606 | Cutera - Inc. - Common Stock | Medical Appliances & Equipment | 96 | 51.95 |
| CYRX | 10.07 | 190,682 | CryoPort - Inc. - Common Stock | Packaging & Containers | 95 | 9.63 |
| WUBA | 82.88 | 1,763,258 | 58.com Inc. American Depositary Shares - each repre | Internet Information Providers | 94 | 80.22 |
| RCKY | 21.70 | 50,295 | Rocky Brands - Inc. - Common Stock | Textile - Apparel Footwear & Accessories | 94 | 20.85 |
| ABAX | 74.22 | 244,458 | ABAXIS - Inc. - Common Stock | Medical Laboratories & Research | 94 | 73.46 |
| DAVE | 8.15 | 92,504 | Famous Dave's of America, Inc. | Restaurants | 94 | 7.10 |
| ALGN | 271.13 | 1,535,523 | Align Technology - Inc. - Common Stock | Medical Appliances & Equipment | 94 | 250.92 |
| These stocks meet our suggested screening factors
for our Cup and Handle Chart Pattern watchlist. See Revised Rules for Trading Cup and Handle Breakouts |
||||||
| Index | Value | Change Week | Change YTD | Trend1 |
|---|---|---|---|---|
| Dow | 23533.2 |
-5.67% | -4.8% | Down |
| NASDAQ | 6992.67 |
-6.54% | 1.29% | Down |
| S&P 500 | 2588.26 |
-5.95% | -3.19% | Down |
|
1The Market Trend is derived from
our proprietary market model. The market model is described on
the site here.
2The site also shows industry rankings based on fundamentals, combined technical and fundamentals, and on price alone. The site also shows daily industry movements. |
||||
| 1 Week | 13 Weeks | 26 Weeks | Year-to-Date |
|---|---|---|---|
| Dow Jones |
NASDAQ Composite 0.47 % |
NASDAQ Composite 8.8 % |
NASDAQ Composite 1.29 % |
| 1 Week | 3 Weeks | 13 Weeks | 26 Weeks |
|---|---|---|---|
| Semiconductor - Memory Chips |
Semiconductor - Memory Chips |
Auto Parts Wholesale |
Resorts & Casinos |
| Foreign Utilities 75 |
Manufactured Housing 215 |
Manufactured Housing 209 |
Personal Computers 214 |
| Charts of each industry rank and performance over 12 months are available on the site | |||
If you received this newsletter from a friend and you would like to receive it regularly please go to the BreakoutWatch.com site and you will then be able to register to receive the newsletter.
Copyright (c) 03/24/2018 NBIcharts, LLC dba BreakoutWatch.com. All
rights reserved.
" BreakoutWatch," the BreakoutWatch.com "eye" logo, and the slogan
"tomorrow's breakouts today" are service marks of NBIcharts LLC. All
other marks are the property of their respective owners, and are used
for descriptive purposes only.
BreakoutWatch is not affiliated with Investor's Business Daily or with Mr. William O'Neil. Our site, research and analysis is supported entirely by subscription and is free from advertising.