| Market Summary | Weekly Breakout Report | Top Breakout Choices | Top 2nd Chances | New Features | Tip of the Week |
| Index | Value | Change Week | Change YTD | Market1 Signal |
Commentary | |||||||||||||||||||||||||||||||
|---|---|---|---|---|---|---|---|---|---|---|---|---|---|---|---|---|---|---|---|---|---|---|---|---|---|---|---|---|---|---|---|---|---|---|---|---|
| Dow | 10456.9 | -0.78% | 0.45% | enter | The rally paused this week with all indexes losing ground. A minor selloff on Tuesday was followed by a major bout of profit taking on Friday. The NASDAQ suffered two distribution days but still managed a better performance for the week overall than the other two indexes. This does not mean the end of the rally, however. The NASDAQ would have to suffer 5 distribution days within 15 sessions before our market signal model would signal the rally was truly over. We discuss our market signal model further in out 'Top Tip' section below. As one would expect given the overall market conditions, the number of sustained breakouts this week was down nearly 20% compared to last week, and the gains by confirmed breakouts was also lower. Fewer breakouts when market conditions deteriorate is a positive result as fewer opportunities should also mean capital is conserved. Also, the number of confirmed breakouts each day is an indicator of market strength or weakness. Breakouts made positive gains while the markets lost ground. DHB was the top performer of the week with a gain of 13.7% since its breakout on Monday. This stock rated highly on our CANTATA evaluator (CE) score. NGPS, also with a strong CE score, offered the best opportunity of the week with an intraday gain after breakout of 23.2%. The building sector produced the most breakouts with 5 for the week followed by Healthcare and Electronics with 4 each. |
|||||||||||||||||||||||||||||||
| NASDAQ | 2070.63 | -0.71% | 3.19% | enter | ||||||||||||||||||||||||||||||||
| S&P 500 | 1170.34 | -1.17% | 5.58% | enter | ||||||||||||||||||||||||||||||||
1The Market Signal is derived from our proprietary
market model. The market model is described on the site. |
||||||||||||||||||||||||||||||||||||
# of Breakouts
|
Period Average1
|
Max. Gain During Period2
|
Gain at Period Close3
|
|
|---|---|---|---|---|
| This Week | 39 | 43.85 | 6.07% | 1.64% |
| Last Week | 47 | 42.77 | 11.36% | 9.03% |
| 13 Weeks | 572 | N/A | 15.74% |
8.15% |
Sector
|
Industry
|
Breakout Count for Week
|
|---|---|---|
Telecomm
|
Telecomm-Equipment
|
3
|
Computer Software
|
Comp Software-Enterprise
|
2
|
Electronics
|
Electr-Parts Distrib
|
2
|
Healthcare
|
Healthcare-Instruments
|
2
|
Media
|
Media-Cable/Satellite TV
|
2
|
Aerospace & Defense
|
Aerospace & Defense-Equip
|
1
|
Banks
|
Banks-Northeast
|
1
|
Building
|
Building-Mobile/Mfg/RV
|
1
|
Building
|
Building-Maint & Services
|
1
|
Building
|
Building-Heavy Constr
|
1
|
Building
|
Building-Residentl/Comml
|
1
|
Building
|
Building-Products/Misc
|
1
|
Business Services
|
Business Svcs-Sec/Safety
|
1
|
Computer
|
Computer-Networking
|
1
|
Computer
|
Computer-Peripheral Equip
|
1
|
Computer
|
Computer-Storage Devices
|
1
|
Diversified Operations
|
Diversified Operations
|
1
|
Electronics
|
Electr-Misc Products
|
1
|
Electronics
|
Electr-Semicndtr Equip
|
1
|
Electronics
|
Electr-Semicndtr Mfg
|
1
|
Finance
|
Finance-Misc Services
|
1
|
Healthcare
|
Healthcare-Biomed/Genetic
|
1
|
Healthcare
|
Healthcare-Drugs/Ethical
|
1
|
Healthcare
|
Healthcare-Outpnt/HmCare
|
1
|
Home
|
Home-Furniture
|
1
|
Internet
|
Internet-Software
|
1
|
Leisure
|
Leisure-Services
|
1
|
Leisure
|
Leisure-Movies & Related
|
1
|
Machinery
|
Machinery-Matl Hdlg/Autom
|
1
|
Special
|
Special-Market/Tracking Funds
|
1
|
Telecomm
|
Telecomm-Services US
|
1
|
Textile
|
Textile-Household Prod
|
1
|
Transportation
|
Transportation -Airlines
|
1
|
2This represents the return if each stock were bought at its breakout price and sold at its intraday high.
3This represents the return if each stock were bought at its breakout price and sold at the most recent close.
Category |
Symbol |
Company Name |
Expected Gain1 |
|---|---|---|---|
| Top Technical | OBIE | Obie Media Corp. | 74 |
| Top Fundamental | CCBI | Commercial Cap Bancorp Inc. | 55 |
| Top Tech. & Fund. | CCBI | Commercial Cap Bancorp Inc. | 55 |
Category |
Symbol |
Company Name |
Expected Gain1 |
|---|---|---|---|
| Best Overall | NANO | Nanometrics Inc. | 117 |
| Top Technical | QSND | QSound Labs Inc. | 84 |
| Top Fundamental | ISSC | Innovative Solutions and Support, Inc | 78 |
| Top Tech. & Fund. | TPX | Tempur-pedic International Inc | 88 |
There were no new features added this week.
Use the market to help you decide when to buy or sell
Is the election rally over? Is it time to take profits and move to cash? These are the questions we ask ourselves as the current rally seems to falter. We'll get to a tentative answer in a moment, but first a little bit of theory.
No one can have a crystal ball so we must be guided by history, while acknowledging that past performance is no guarantee of future gains (or losses!).
Each individual stock may have its own merits but in general the best time to invest in breakouts is when the market is confirmed to be rising, and it is best to take profits when the market is confirmed to be falling. We have built a model derived from Dow Jones and S&P 500 data since 1950 and NASDAQ data since 1990 that does an excellent job of predicting the times when you should enter and exit the markets. Since 1990, the model beat the S&P 500 by 93%, the DJI by 28% and the NASDAQ by 90%. You can read about the model here.
The model is based on generating entry and exit signals based on the number of accumulation and/or distribution days within given periods (that vary depending on the index under consideration) combined with price/volume information. Each day on the BreakoutWatch.com site we present the information relevant to the model in the form of an equivolume chart which concisely summarizes the relevant information. The most recent (11/19/2004) equivolume chart for the NASDAQ is shown below and you can learn more about equivolume charts here.
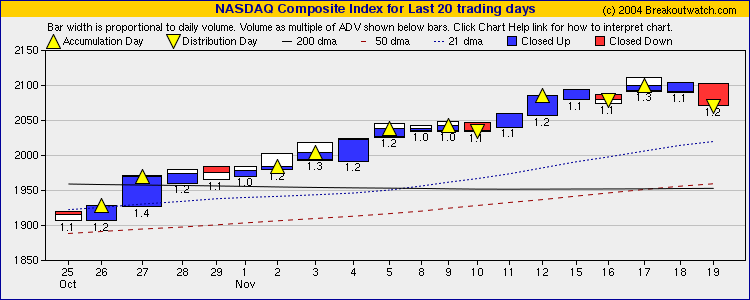
The chart shows the rising trend over the last 4 weeks on above average volume but with profit taking beginning to set in beginning on November 10. The chart shows three distribution days in the last 8 sessions and that the trend appears to have peaked at the intra-day high on November 17. However, our model tells us that we are still in a confirmed uptrend as it would require 5 distribution days within 15 sessions to trigger an exit signal.
The model has performed well over the last 14 years, but does it work in the current market? This has been a difficult year, so lets look at the model's performance for 2004.
Lets assume that we bought the NASDAQ composite at the closing price on 12/31/2003 and then sold or bought it on each enter exit signal since then. While the NASDAQ rose only 3.36% for the year, we would have gained 17.86% (assuming we reinvested our profits from each sale).
| Date | Action | Index | Gain | Reinvested Gain |
|---|---|---|---|---|
12/31/2003 |
Buy |
2003.37 |
||
1/29/2004 |
Sell |
2068.23 |
3.24% |
3.24% |
5/25/2004 |
Buy |
1964.65 |
||
6/17/2004 |
Sell |
1983.67 |
0.97% |
4.24% |
8/18/2004 |
Buy |
1831.37 |
||
11/19/2004 |
Hold |
2070.63 |
13.06% |
17.86% |
Net Result |
3.36% |
17.27% |
17.86% |
We can see how our enter and exit signals would have saved us from the bad times and profited from the good in the following chart.
So our tentative answer is, stay invested for now, but watch those distribution days. For regular subscribers, this is easy because we publish our signals for each index on the site each day.
If you received this newletter from a friend and you would like to receive it regularly please go to the BreakoutWatch.com site and enter as a Guest.
Copyright © 2004 NBIcharts, LLC dba BreakoutWatch.com. All rights reserved.