| Market Summary | Weekly Breakout Report | Top Breakout Choices | Top 2nd Chances | New Features | Tip of the Week |
Market Summary
Stocks finished the week with a mixed performance compared to a week ago as oil prices again crested $60 a barrel. Investors chose to close the month out by taking some profits on Friday and the DJI, which has shown itself to be the index most sensitive to oil price rises, lost 0.1%. The S&P, which also contains oil sensitive stocks, rose just 0.4% while the NASDAQ Composite gained 0.23%. This was the fifth straight week of gains for the broader indexes which are still under accumulation. The NASDAQ has recorded 8 accumulation days since the current rally was revived on July 7 and gained 6.5%. The S&P 500 is also under accumulation with seven accumulation days and a gain of 4.3% in the same period. For the last week, however, the markets have been consolidating (moving sideways) as they digest the recent gains. With the economy growing steadily and consumer confidence still high, we expect this consolidation with a slight upward bias to continue unless an external shock intervenes.
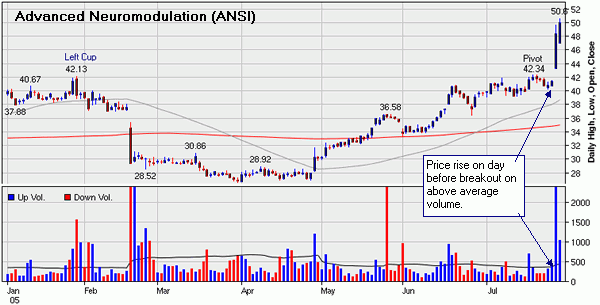
This was an excellent week for breakouts with 44 confirmed and an average gain at the end of the week of 4.06%. ANSI (Advanced Neuromodulation) broke out from a 7 month cup-with-handle pattern on Thursday and gained 16.5% on nearly seven times average volume. ANSI rose again on Friday to close the week for an 18.2% gain. ANSI is an excellent example of a stock that rose in price on above average volume on the day before breakout and thereby signalled a possible strong breakout to come.. As we have reported several times, this often signals a much stronger than average breakout, and our filters allow you to screen for stocks like this on the evening before breakout. Our email and cell-phone alerts allow you to get in at the earliest possible time as the stock breaks out.
Other breakouts that made strong double digit gains this week were WHQ (W-H Energy Services), 13.32%, CBI (Chicago Bridge and Iron), 10.74%, MOBE (Mobility Electronics), 10.58% and MIDD, (Middleby Corp), 10.33%.
Imminent Subscription Price Increase
Substantial value has been added to to breakoutwatch.com since our last price increase over a year ago and we are dedicated to continuous improvement. To finance our ongoing development we must raise our subscription prices which will rise by approximately 10% on August 1, 2005. You can beat the price increase by subscribing now or renewing or upgrading your subscription before July 31. Our new rates are published here. A comparison of the different subscription levels is published here. This is your last two days to renew or convert your Trial to a full subscription before the price goes up. Existing subscriptions get extended by the length of the renewal.
Get a 14 day Trial of our premium 'Platinum' service for just $9.95 and if you subsequently subscribe to any subscription level we will credit your $9.95 to your subscription. 14
Day Platinum Trial |
Links to the Technical Analysis charts were added to the CwH (cup-with-handle) charts and to the ChartBrowser.
Five new fields were added to the Recent Breakouts download: RCQ, HQ, breakout day open, high and low.
Stock Selection Based on Breakout Results
A subscriber, we'll call him David, who is a physician with experience with clinical trials, has applied his statistical expertise to the problem of which stocks to select after breakout. Today we share with you the preliminary results of that analysis, which is still ongoing. It is important to note that his analysis does not include the recently improved method of calculating Handle Quality (HQ).
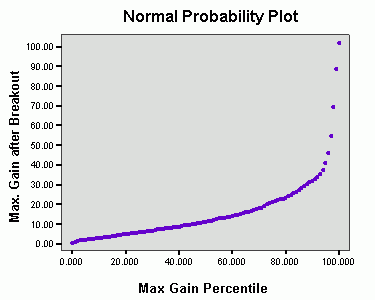
David began by downloading the data from the Recent Breakouts Report and plotting the maximum gain since breakout as a percentile

He then looked for metrics that would allow him to discriminate the top 20% of breakouts from the rest. In addition to the published metrics, David was also interested in knowing if the close on breakout day in relation to the price range on breakout day had an influence on eventual performance. Using the new data added to the download this week, he was able to create a new metric which expressed the close on breakout day as a percentage of the range on breakout day. David now looked at which variables were significant in discriminating the top 20% from the lower 80% of breakouts, for which he used Student's T-test. In addition to knowing which metrics were significant discriminators, in the strict statistical sense, he also wanted to know how useful they were in a practical sense, so he also calculated the mean of each metric and took the ratio of the means.
| Student's t-test splitting data into best 20% versus the other 80% | ||||||||||
| B'out Vol | B'out | B'out | B'out | B'out | B'out day | Expected | B'out | B'out | B'out Close | |
|---|---|---|---|---|---|---|---|---|---|---|
| % ADV | RS | HQ | RCQ | CQ | % Gain | Gain | CET | CEF | % (Hi-Lo) | |
| T-test 20/80 | 0.056 | 8.0E-08 | 0.51 | 0.0018 | 0.0013 | 0.024 | 0.77 | 0.00039 | 0.75 | 0.05 |
| Mean 20% | 343 | 87.9 | 0.2 | 1.056 | 1.24 | 3.15 | 46.5 | 5.96 | 7.12 | 73.6 |
| Mean 80% | 277 | 83 | 0.17 | 0.713 | 0.86 | 2.24 | 47.6 | 5.81 | 7.19 | 78.2 |
| Ratio 20/80 | 1.24 | 1.06 | 1.15 | 1.48 | 1.43 | 1.4 | 0.97 | 1.02 | 0.99 | 0.94 |
Significant |
||||||||||
Useful |
||||||||||
David concluded that although RS, CET and Close % of Hi-Lo were statistically significant, the ratio of their 20% and 80% means was so close to 1 as to be not useful. Quoting David, "Metrics with the largest ratio offer the best chance of setting a threshold level that will prove profitable." Therefore, David concluded that the best filters for selecting stocks to buy when breakout is confirmed are based on RCQ, CQ and % Gain over BoP on breakout day. The question then remains as to what values of these metrics provide the optimal discrimination.
David hasn't come to any conclusions about the answer to this question, but I'll make my own observations as follows.
- Because each of the three metrics is a valid discriminator, any one of them could be used alone, or in combination with the others
- RCQ is highly correlated with CQ, so we need only use one of these metrics.
- Threshold values could logically be chosen as the values 1 standard deviation greater than the mean.
| Mean | S.D. | Mean + 1 S.D. |
|
|---|---|---|---|
| RCQ | 0.77 | 0.79 | 1.56 |
| CQ | 0.95 | 0.83 | 1.78 |
| BO Gain % | 2.48 | 2.86 | 5.34 |
Applying the filters (RCQ >= 1.56 OR CQ >= 1.78) AND BO Gain % >= 5.34 to the breakouts over the last three months selected 9 breakouts with an average gain of 49.4%. This is an impressive result, but may be considered too selective. Changing the filter to use the same threshold values for RCQ and CQ but using the mean (2.48) as the threshold for BO Gain % found 30 breakouts with an average gain of 29%.
Conclusion
This is a report of a work-in-progress that promises to be very beneficial to subscribers who prefer to wait for confirmed breakouts before making an investment decision. The work needs to be expanded to include the new values of HQ and to optimize the threshold values of the discriminant metrics. We'll keep you posted.
If you would like further information on this work, or wish to comment, please use the Breakoutwatch Forum to further the discussion.
Get a 14 day Trial of our premium 'Platinum' service for just $9.95 and if you subsequently subscribe to any subscription level we will credit your $9.95 to your subscription. 14
Day Platinum Trial |
| Index | Value | Change Week | Change YTD | Market1 Signal |
||||||||||||||||||||||||||||||||||||
|---|---|---|---|---|---|---|---|---|---|---|---|---|---|---|---|---|---|---|---|---|---|---|---|---|---|---|---|---|---|---|---|---|---|---|---|---|---|---|---|---|
| Dow | 10640.9 | -0.1% | -1.32% | enter | ||||||||||||||||||||||||||||||||||||
| NASDAQ | 2184.83 | 0.23% | 0.43% | enter | ||||||||||||||||||||||||||||||||||||
| S&P 500 | 1234.18 | 0.04% | 1.84% | enter | ||||||||||||||||||||||||||||||||||||
1The Market Signal is derived from our proprietary
market model. The market model is described on the site. 2The site also shows industry rankings based on fundamentals, combined technical and fundamentals, and on price alone (similar to IBD). The site also shows daily industry movements. |
||||||||||||||||||||||||||||||||||||||||
# of Breakouts
|
Period Average1
|
Max. Gain During Period2
|
Gain at Period Close3
|
|
|---|---|---|---|---|
| This Week | 44 | 38.85 | 6.35% | 4.07% |
| Last Week | 59 | 37.69 | 7.66% | 3.39% |
| 13 Weeks | 524 | 40.92 | 15.85% |
10.21% |
Sector
|
Industry
|
Breakout Count for Week
|
|---|---|---|
Healthcare
|
Healthcare-Instruments
|
3
|
Oil & Gas
|
Oil & Gas-U S Explr/Prod
|
3
|
Banks
|
Banks-Foreign
|
2
|
Computer
|
Computer-Services
|
2
|
Computer Software
|
Comp Software-Enterprise
|
2
|
Electronics
|
Electr-Semicndtr Equip
|
2
|
Oil & Gas
|
Oil & Gas-Field Services
|
2
|
Retail
|
Retail-Auto Parts
|
2
|
Building
|
Building-Heavy Constr
|
1
|
Business Services
|
Business Svcs-Leasing
|
1
|
Chemical
|
Chemical-Specialty
|
1
|
Computer
|
Computer-Graphics
|
1
|
Computer
|
Computer-Peripheral Equip
|
1
|
Computer
|
Computer-Integrated Sys
|
1
|
Computer
|
Computer-Storage Devices
|
1
|
Computer Software
|
Comp Software-Healthcare
|
1
|
Food
|
Food-Candy
|
1
|
Healthcare
|
Healthcare-Products
|
1
|
Home
|
Home-Appliances
|
1
|
Insurance
|
Insurance-Prop/Casualty/TItl
|
1
|
Internet
|
Internet-Software
|
1
|
Internet
|
Internet-ISP/Content
|
1
|
Leisure
|
Leisure-Gaming
|
1
|
Machinery
|
Machinery-Const/Mining
|
1
|
Machinery
|
Machinery-Machine Tools
|
1
|
Metal Prds
|
Metal Prds-Pipe/Fab/Misc
|
1
|
Retail
|
Retail-Apparel
|
1
|
Retail
|
Retail-Mail Order/Direct
|
1
|
Steel
|
Steel -Producers
|
1
|
Telecomm
|
Telecomm-Services Fgn
|
1
|
Telecomm
|
Telecomm-Equipment
|
1
|
Transportation
|
Transportation-Ship
|
1
|
Utility
|
Utility-Electric
|
1
|
2This represents the return if each stock were bought at its breakout price and sold at its intraday high.
3This represents the return if each stock were bought at its breakout price and sold at the most recent close.
Category |
Symbol |
Company Name |
Expected Gain1 |
|---|---|---|---|
| Best Overall | SIRI | SIRIUS SATELLITE RADIO INC | 123 |
| Top Technical | CITP | COMSYS IT Partners Inc | 62 |
| Top Fundamental | CTGI | CAPITAL TITLE GROUP INC | 88 |
| Top Tech. & Fund. | CTGI | CAPITAL TITLE GROUP INC | 88 |
Category |
Symbol |
Company Name |
Expected Gain1 |
|---|---|---|---|
| Best Overall | LTXX | LTX CORP | 126 |
| Top Technical | DATA | DATATRAK INTL INC | 67 |
| Top Fundamental | CRM | Salesforce.com Inc. | 69 |
| Top Tech. & Fund. | CRM | Salesforce.com Inc. | 69 |
If you received this newletter from a friend and you would like to receive it regularly please go to the BreakoutWatch.com site and enter as a Guest. You will then be able to register to receive the newsletter.
Copyright © 2005 NBIcharts, LLC dba BreakoutWatch.com. All rights reserved.
