| Market Summary | Weekly Breakout Report | Top Breakout Choices | Top 2nd Chances | New Features | Tip of the Week |
Market Summary
The major indexes gained ground this week with large cap stocks benefiting most from falling crude oil prices, a positive economic outlook from the new Fed Chairman and renewed hope that although at least one further interest rate increase was likely, the tighter money policy might soon be relaxed. A few clouds darkened the horizon on Friday as crude prices rose, there was evidence of increasing inflation at the wholesale level, and consumer confidence slipped. For the week the DJI jumped 1.8%, the NASDQ Composite rose 0.91% and the S&P 500 gained 1.6%. The Dow is now the best performing index year-to-date, followed by the NASDAQ and then the S&P 500.
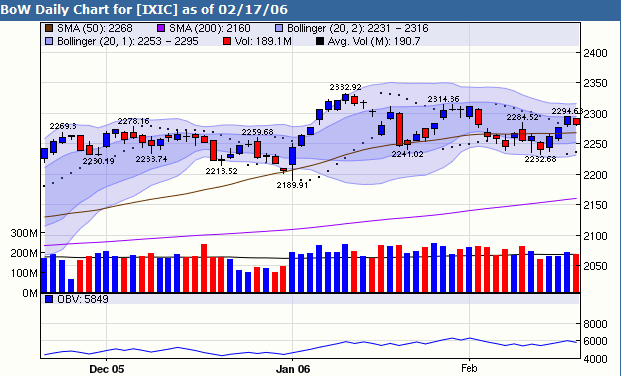
The NASDAQ began to turnaround on Tuesday and there was hope of a follow through day on Friday which would have flipped our market model signal to 'enter'. Alas, a disappointing profit forecast from Dell, along with the other macroeconomic factors cited above, held the index back and the signal remained at 'exit. Nevertheless, as can be seen from the chart below, the index has overcome resistance at the 50 day moving average level, the On Balance Volume trend, which is an indicator of institutional interest has turned up and the Parabolic Stop and Reverse indicator changed direction on Thursday from sell to buy. However, since the index is trending sideways, the PSAR is not a reliable indicator of direction.
The number of breakouts remains well below average with just twenty-seven last week for an average gain by week's end of 1.85%. Just four stocks closed out-of-range (that is, at more than 5% over their breakout price) with the top performer being Raven Industries (RAVN) which closed the week 10.75% above its breakout price.
Our top performing industry continued to be Machinery-Construction/Mining with Retail-Discount/Variety being the most improved.
Get a 14 day Trial of our premium 'Platinum' service for just $9.95 and if you subsequently subscribe to any subscription level we will credit your $9.95 to your subscription. 14
Day Platinum Trial |
There were no new features added this week.
We are pleased to be able to introduce an improved version of our Sell Assistant that substantially increases backtested returns from our TradeWatch Best Returns list. All future sell alerts sent from the site will use the new model. This improved version should also improve returns on any stock that was on an upward trend at time of purchase. This includes all breakouts from CwHwatch, FBwatch and DBwatch.
The new model improves the average returns on an individual stock by 30.8% and the non-compounded annualized return by 29.4% (using data as of 2/16/06).
| Sell Model Version 1 | Sell Model Version 2 |
|---|---|
| No. of Positions Closed: 74 Avg. % Gain on Closed Positions: 7.2 Avg. Hold Period: 51 days Annualized Return: 51% |
No. of Positions Closed: 73 Avg. % Gain on Closed Positions: 9.42 Avg. Hold Period: 51 days Annualized Return: 66% |
The improvements to the model were achieved in two ways:
- Taking profits when the stock shows signs of weakness after gaining at least 25%.
- Cutting losses when the stock gaps down and closes below its 50 day moving average.
- We use On Balance Volume (OBV) in addition to the Price Volume Oscillator (PVO) to allow winners to run.
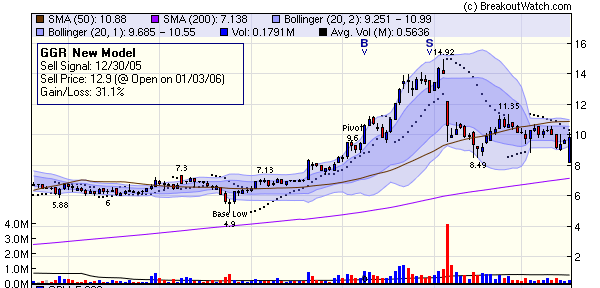
Example of taking profits
Under the old model, we took a loss on GGR after it gained 55% and then plummeted.
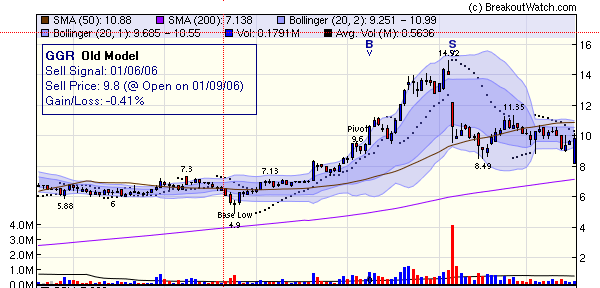
Under the new model we sell as the stock turns down after crossing into the inner Bollinger Band and turn a potential loss into a 31% profit.
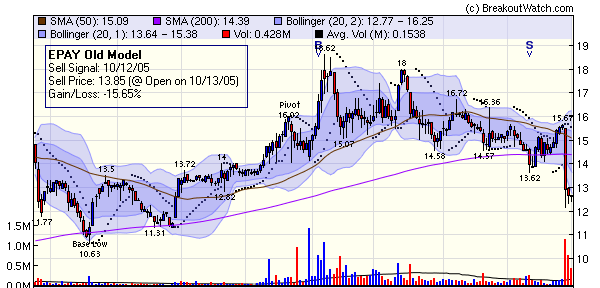
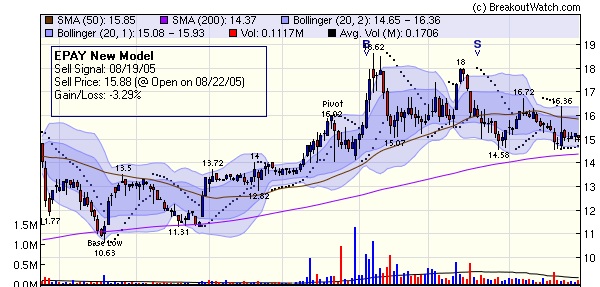
Example of Cutting Losses
Our old model allowed EPAY to drop over 15% below the buy price before the PVO confirmed a sell signal.
The now model sells EPAY as it gaps down below the 50 day moving average for a loss of just 3.3%.
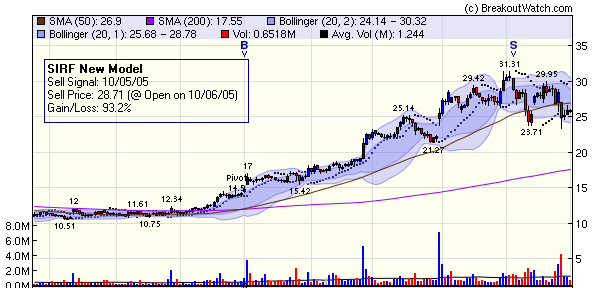
Example of allowing profits to run
Our old sell model sold SIRF for a 'mere' 44% gain after it crossed two Bollinger Bands and the PVO turned positive.
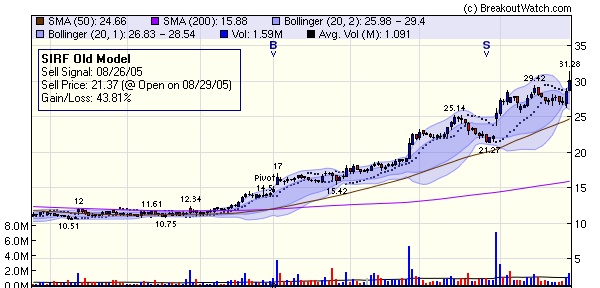
However, the OBV trend was still positive and our new model waits until both the OBV and PVO confirm the sell signal. This allows the stock to gain 93% before a sell signal is generated.
The new model is now operational on the site and is used by the Sell Assistant. The TradeWatch Best Return history has been updated to reflect the Sell Signals. The old version has been archived here.
Market Signals Update
Last week we presented figures showing the returns that would have been obtained from using our NASDAQ market signal to trade in QQQQ. Some subscribers questioned as to why the annual returns for QQQQ using our market signals to buy, sell, short or cover did not add up to the overall return for the five year period 2000 - 2005. The reason was that the individual yearly returns only included trades opened and closed during the year. Consequently, trades that straddled a year were not included. Here are the yearly returns for trading both long and short positions assuming you opened a position at the start of the year based on the signal in effect at that time and closing the position at the end of the year.
Year |
QQQQ Gain % |
Market Signal Long & Short Gain % |
|---|---|---|
2000 |
-36% |
61.64 |
2001* |
-31.18 |
29.79 |
2002 |
-37.97 |
16.87 |
2003 |
48.14 |
5.13 |
| 2004 | 9.19 |
24.22 |
| 2005 | 1.2 |
8.82 |
| Total | -15.44% |
146.47% |
| * Signal was 'exit' for entire year | ||
You are welcome to use the tool to test the market signals against a number of ETF's including QQQQ, SPY, DIA and so on. The link to the tool is http://www.breakoutwatch.com/marketIndexes/signalReturnsETF.php
Please post questions and comments to the Breakoutwatch Forum.
Get a 14 day Trial of our premium 'Platinum' service for just $9.95 and if you subsequently subscribe to any subscription level we will credit your $9.95 to your subscription. 14
Day Platinum Trial |
| Index | Value | Change Week | Change YTD | Market1 Signal |
||||||||||||||||||||||||||||||||||||
|---|---|---|---|---|---|---|---|---|---|---|---|---|---|---|---|---|---|---|---|---|---|---|---|---|---|---|---|---|---|---|---|---|---|---|---|---|---|---|---|---|
| Dow | 11115.3 | 1.8% | 3.71% | enter | ||||||||||||||||||||||||||||||||||||
| NASDAQ | 2282.36 | 0.91% | 3.49% | exit | ||||||||||||||||||||||||||||||||||||
| S&P 500 | 1287.24 | 1.6% | 3.12% | enter | ||||||||||||||||||||||||||||||||||||
1The Market Signal is derived from our proprietary
market model. The market model is described on the site. 2The site also shows industry rankings based on fundamentals, combined technical and fundamentals, and on price alone (similar to IBD). The site also shows daily industry movements. |
||||||||||||||||||||||||||||||||||||||||
# of Breakouts
|
Period Average1
|
Max. Gain During Period2
|
Gain at Period Close3
|
|
|---|---|---|---|---|
| This Week | 27 | 37.54 | 4.29% | 1.85% |
| Last Week | 45 | 38.31 | 5.09% | 0.4% |
| 13 Weeks | 557 | 40.23 | 14.58% |
5.72% |
Sector
|
Industry
|
Breakout Count for Week
|
|---|---|---|
Business Services
|
Business Svcs-Misc
|
2
|
Computer Software
|
Comp Software-Enterprise
|
2
|
Electronics
|
Electr-Semicndtr Equip
|
2
|
Insurance
|
Insurance-Life
|
2
|
Retail
|
Retail-Apparel
|
2
|
Utility
|
Utility-Electric
|
2
|
Aerospace & Defense
|
Aerospace & Defense-Equip
|
1
|
Beverages
|
Beverages-Alcoholic
|
1
|
Building
|
Building-Products/Misc
|
1
|
Chemical
|
Chemical-Plastics
|
1
|
Diversified Operations
|
Diversified Operations
|
1
|
Electronics
|
Electr-Misc Products
|
1
|
Finance
|
Finance-Invest Management
|
1
|
Finance
|
Finance-Savings&Loan
|
1
|
Healthcare
|
Healthcare-Med/Dent Services
|
1
|
Healthcare
|
Healthcare-Drugs/Ethical
|
1
|
Insurance
|
Insurance-Prop/Casualty/TItl
|
1
|
Metal Prds
|
Metal Prds-Pipe/Fab/Misc
|
1
|
Retail
|
Retail-Auto Parts
|
1
|
Utility
|
Utility-Gas
|
1
|
2This represents the return if each stock were bought at its breakout price and sold at its intraday high.
3This represents the return if each stock were bought at its breakout price and sold at the most recent close.
Category |
Symbol |
Company Name |
Expected Gain1 |
|---|---|---|---|
| Best Overall | MED | Medifast Inc | 96 |
| Top Technical | MED | Medifast Inc | 96 |
| Top Fundamental | COG | Cabot Oil & Gas Corp | 26 |
| Top Tech. & Fund. | FTO | Frontier Oil Corp | 39 |
Category |
Symbol |
Company Name |
Expected Gain1 |
|---|---|---|---|
| Best Overall | ININ | Interactive Intelligence | 87 |
| Top Technical | ININ | Interactive Intelligence | 87 |
| Top Fundamental | CHS | Chico's Fas Inc | 14 |
| Top Tech. & Fund. | CHS | Chico's Fas Inc | 14 |
If you received this newletter from a friend and you would like to receive it regularly please go to the BreakoutWatch.com site and enter as a Guest. You will then be able to register to receive the newsletter.
Copyright © 2006 NBIcharts, LLC dba BreakoutWatch.com. All rights reserved.