| Market Summary | Weekly Breakout Report | Top Breakout Choices | Top 2nd Chances | New Features | Tip of the Week |
Market Summary
Fed Chairman Bernanke finally decided to stop equivocating this week and deliver what he had promised, which was more 'transparency' about the Fed's policies. The markets did not like the message and Bernanke's statements started a week long decline which left the DJI 3.2% lower, the S&P 500 off 2.8% and the NASDAQ lower still with a 3.8% decline. In the longer term, this correction will surely be helpful for the markets, but in the short term some investors are suffering. At least our subscribers are not among them (hopefully!). The realities are that the economy is slowing while commodity prices remain high and contribute to inflationary pressures. Bernanke confirmed that the Fed will fight inflation by raising interest rates, which increases the cost of borrowing and thereby reduces demand. Ultimately this policy will succeed. As demand falls commodity prices will fall also as they obey the law of supply and demand and inflationary pressure will be reduced. A stationary point on the demand curve will be reached and there will be momentary equilibrium. The markets understand this logic, but what they really fear is that company profits will be hurt significantly in the meantime and therefore investors want a discount on any investments they may make. Hence stock markets fall and this will continue until investors perceive the discount is in line with expected investment returns.
The explanation provided above is consistent with the commentary we read in the daily press and is hard to argue with, except as equity prices fall we have not seen a significant flight to safety, as represented by bonds and precious metals. Bonds have risen slightly but Gold has actually declined recently, including this week. An investment analyst friend explained this by pointing out that the Bank of Japan has been withdrawing liquidity from the market at the rate of $5B per day, not pocket change. At the same time, the US homeowners are feeling less wealthy as their home value stabilizes or falls and there is much less liquidity available from refinancing, which has arguably supported the recent bull market in stocks. A fall in liquidity, whether from international or domestic sources, inevitably reduces funds available for speculation and stock prices consequently fall.
How far will they fall? Market technicians look at trend support lines and assume that a trend will continue, with mild corrections, until the trend line is broken. As we have seen in this article over the past few weeks, the NASDAQ trend line was broken but the DOW and S&P 500 primary upwards trend has remained intact. This weeks action has brought this into question as the S&P failed to find support at the 200 dma level and the DJI recovered from far below the 200 dma on Thursday and then tested the 200 dma again on Friday. The DJI can fall another 500 points before the primary trend is broken.
Whereas the S&P 500 is almost at the tipping point.
A break below 1240 will be bearish for the S&P which will put further pressure on the DJI.
| Get a 14 day Trial of
our premium 'Platinum' service and TradeWatch for just $9.95 and
if you subsequently subscribe to any subscription
level we will credit your $9.95 to your subscription.
14
Day Platinum Trial |
There were no new features added this week.
With the markets declining it is time to revisit short selling. We issue breakdown alerts from ShortsaleWatch and also for breakdowns from our FlatbaseWatch list. Our ShortsaleWatch list selects stocks that are showing weakness and may be poised to breakdown. Since May 10, when we issued our exit signal for the NASDAQ market there have been 36 confirmed breakdowns from ShortsaleWatch for an average loss through to yesterday (9/6/06) of 10.24%. The average decline to intraday low since May 10 was 15.4%. For comparison, the equivalent losses for breakdowns from our FlatbaseWatch list were an average of 1.93% through to 9/6/06 and 3.93% to the intraday low. This shows that our breakdown alerts from ShortsaleWatch are the ones to watch for.
The criteria for selection for ShortsaleWatch are:
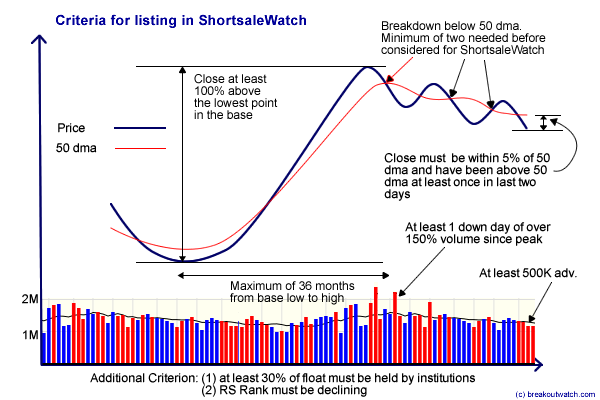
If the current decline continues, we will develop additional short sale patterns and devote more time to developing TradeWatch equivalents for short sales.
Meantime, you may find our ShortsaleWatch Help document interesting and also our newsletter articles: How to use ShortsaleWatch Alerts and Interpreting Short Interest
Investment Advisors Using our Service
TradeRight Securities, located in a suburb of Chicago, is a full services investment management company and broker/dealer. They have been a subscriber, and user, of BreakoutWatch.com for some time now. They practice CANTATA and use Breakoutwatch.com as a “research analyst”. You can learn more about TradeRight Securities at: www.traderightsecurities.com. If you’re interested in speaking to a representative, simply call them toll-free at 1-800-308-3938 or e-mail gdragel@traderightsecurities.com.
PivotPoint Advisors, LLC takes a technical approach to investment planning and management. A breakoutwatch.com subscriber since May, 2004, they use breakouts, market signals, and now TradeWatch to enhance returns for their clients. Learn more at http://pivotpointadvisors.net or contact John Norquay at 608-826-0840 or by email at john.norquay@pivotpointadvisors.net.
Note to advisors: If you would like to be listed here, please contact us. As a service to those who subscribe to us, there is no additional charge to be listed here.
| Get a 14 day Trial of
our premium 'Platinum' service and TradeWatch for just $9.95 and
if you subsequently subscribe to any subscription
level we will credit your $9.95 to your subscription.
14
Day Platinum Trial |
| Index | Value | Change Week | Change YTD | Market1 Signal |
||||||||||||||||||||||||||||||||||||
|---|---|---|---|---|---|---|---|---|---|---|---|---|---|---|---|---|---|---|---|---|---|---|---|---|---|---|---|---|---|---|---|---|---|---|---|---|---|---|---|---|
| Dow | 10891.9 | -3.17% | 1.63% | enter | ||||||||||||||||||||||||||||||||||||
| NASDAQ | 2135.06 | -3.8% | -3.19% | exit | ||||||||||||||||||||||||||||||||||||
| S&P 500 | 1252.3 | -2.79% | 0.32% | enter | ||||||||||||||||||||||||||||||||||||
1The Market Signal is derived from our proprietary
market model. The market model is described on the site. 2The site also shows industry rankings based on fundamentals, combined technical and fundamentals, and on price alone (similar to IBD). The site also shows daily industry movements. |
||||||||||||||||||||||||||||||||||||||||
# of Breakouts
|
Period Average1
|
Max. Gain During Period2
|
Gain at Period Close3
|
|
|---|---|---|---|---|
| This Week | 13 | 21.92 | 1.75% | -0.45% |
| Last Week | 13 | 22.46 | 2.99% | -0.96% |
| 13 Weeks | 340 | 23.23 | 13% |
-5.36% |
Sector
|
Industry
|
Breakout Count for Week
|
|---|---|---|
Special
|
Special-ClsdEndFunds/Bond
|
3
|
Banks
|
Banks-West/Southwest
|
2
|
Computer Software
|
Comp Software-Enterprise
|
1
|
Computer Software
|
Comp Software-Security
|
1
|
Finance
|
Finance-Misc Services
|
1
|
Finance
|
Finance-Savings&Loan
|
1
|
Healthcare
|
Healthcare-Drugs/Ethical
|
1
|
Leisure
|
Leisure-Services
|
1
|
Oil & Gas
|
Oil & Gas-Prod/Pipeline
|
1
|
Retail
|
Retail-Misc/Diversified
|
1
|
2This represents the return if each stock were bought at its breakout price and sold at its intraday high.
3This represents the return if each stock were bought at its breakout price and sold at the most recent close.
Category |
Symbol |
Company Name |
Expected Gain1 |
|---|---|---|---|
| Best Overall | MAIN | Main Street Restaurant Group Inc | 96 |
| Top Technical | HGR | Hanger Orthopedic Group | 60 |
| Top Fundamental | DLB | Dolby Laboratories Inc | 36 |
| Top Tech. & Fund. | FCFS | First Cash Financial Svc | 54 |
Category |
Symbol |
Company Name |
Expected Gain1 |
|---|---|---|---|
| Best Overall | IRN | Rewards Network Inc | 76 |
| Top Technical | SNWL | Sonicwall Incorporated | 71 |
| Top Fundamental | ARXT | Adams Respiratory Therapeutics Inc | 27 |
| Top Tech. & Fund. | ARXT | Adams Respiratory Therapeutics Inc | 27 |
If you received this newletter from a friend and you would like to receive it regularly please go to the BreakoutWatch.com site and enter as a Guest. You will then be able to register to receive the newsletter.
Copyright © 2006 NBIcharts, LLC dba BreakoutWatch.com. All rights reserved.