| Market Summary | Weekly Breakout Report | Top Breakout Choices | Top 2nd Chances | New Features | Tip of the Week |
Market Summary
The NASDAQ Composite was the only major index to end the first week of 2007 with a gain while the broader markets lost ground in the face of further evidence that an interest rate cut is unlikely in the early part of the year. The DJI slipped 0.52%, the S&P 500 gave up 0.61% while the NASDAQ gained 0.61%. Although the markets got off to a soaring start on Wednesday, they were quickly brought back to earth by the release of the FOMC minutes that emphasized that inflation was still a risk and the effects of the housing market recession were not yet fully felt. Another blow was delivered on Friday with news of sharply rising wages which can lead to wage-push inflation. The number of jobs created exceeded expectations, but these were largely in the services sector while jobs were lost in construction, manufacturing and housing. Further losses in these sectors can be expected as the economy continues to slow. On the positive side, oil prices fell sharply, reducing inflationary pressure and hopefully putting more disposable income in consumers pockets as energy costs fall. Investor's are skittish following the gains made since last August and are susceptible to sudden mood swings as each newly released economic indicator or Federal Reserve statement provides contradictory evidence of the economy's direction. This mood is likely to continue until a clear direction is established. For this to happen, valuations must come into line with the Fed's interest rate policy stance and uncertainty over a soft landing for the conomy must be resolved.
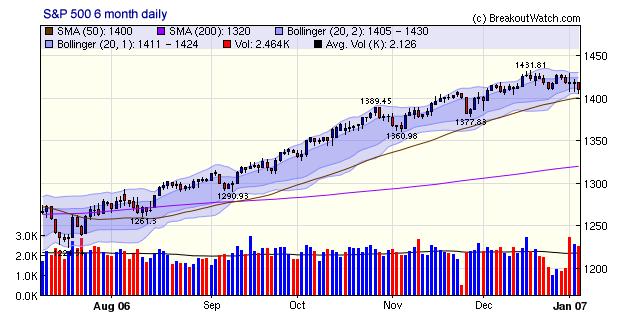
In our last newsletter of 2006, we anticipated a pull-back of the S&P 500 and the 6-month chart shows that pull back is in progress. We see that it found support at its lower 2-standard deviation Bollinger band, but expect it to test the 50 day moving average support level in the near future.
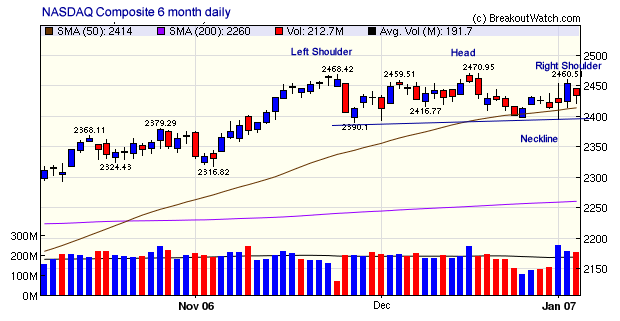
Although the NASDAQ Composite showed resilience this week, it tested its 50 day moving average level on Wednesday and again on Thursday. The chart is showing that a possible head and shoulders pattern is developing. A break through the neckline at just below 2400 would complete the pattern and be a bearish indicator.
| Get a 14 day Trial of our premium 'Platinum'
service and TradeWatch for just $9.95 and if you subsequently subscribe
to any subscription level we will credit your $9.95 to your subscription.
14
Day Platinum Trial |
There were no new features added this week.
Which Industry Rank Measure is Most Significant?
This week, a subscriber asked "Can you direct me to some weekly newsletters that give information on Industry rank/score etc. Which seems to be more critical, the Fundamental rank or the Technical rank, or the Price rank?" This is not a subject that we have addressed in any of our weekly newsletters, so we will do so now.
Firstly, recall that we analyze industries based on four criteria: technical strength, fundamental strength, combined technical and fundamental strength, and price performance over the last 6 months. The methodology used to obtain a score and rank for each industry is described on our Industry Methodology page.
To answer the question, we analyzed breakouts over the last year and compared the correlations between the maximum gain after breakout and the four industry scores for each stock within an industry on the day of breakout. (We would have liked to use a longer period for our analysis, but we do not have consistent industry ranking data for a longer period.) We found the maximum gain correlated with each of the scoring methods as follows:
| Industry Scoring Methodology | Correlation with Maximum Gain after Breakout |
|---|---|
Technical Strength |
0.164** |
Fundamental Strength |
0.069* |
Combined Strength |
0.115** |
Price Strength |
0.017 |
Number of breakouts |
818 |
* Correlation is significant at the 0.05 level (2-tailed). ** Correlation is significant at the 0.01 level (2-tailed). |
|
We see that the highest and most significant correlations are with technical strength and then with combined strength, while fundamental strength alone is more weakly correlated and price is not significantly correlated at all. As our readers know, we have always emphasized technical strength over fundamental strength, and for that reason we always made technical strength the default ranking on our industry analysis page. It is nevertheless surprising that price strength (that is, the performance over the previous 6 months) has little to do with subsequent performance.
Investment Advisors Using our Service
TradeRight Securities, located in a suburb of Chicago, is a full services investment management company and broker/dealer. They have been a subscriber, and user, of BreakoutWatch.com for some time now. They practice CANTATA and use Breakoutwatch.com as a “research analyst”. You can learn more about TradeRight Securities at: www.traderightsecurities.com. If you’re interested in speaking to a representative, simply call them toll-free at 1-800-308-3938 or e-mail gdragel@traderightsecurities.com.
PivotPoint Advisors, LLC takes a technical approach to investment planning and management. A breakoutwatch.com subscriber since May, 2004, they use breakouts, market signals, and now TradeWatch to enhance returns for their clients. Learn more at http://pivotpointadvisors.net or contact John Norquay at 608-826-0840 or by email at john.norquay@pivotpointadvisors.net.
Note to advisors: If you would like to be listed here, please contact us. As a service to those who subscribe to us, there is no additional charge to be listed here.
| Get a 14 day Trial of
our premium 'Platinum' service and TradeWatch for just $9.95 and
if you subsequently subscribe to any subscription
level we will credit your $9.95 to your subscription.
14
Day Platinum Trial |
| Index | Value | Change Week | Change YTD | Market1 Signal |
||||||||||||||||||||||||||||||||||||
|---|---|---|---|---|---|---|---|---|---|---|---|---|---|---|---|---|---|---|---|---|---|---|---|---|---|---|---|---|---|---|---|---|---|---|---|---|---|---|---|---|
| Dow | 12398 | -0.52% | -0.52% | enter | ||||||||||||||||||||||||||||||||||||
| NASDAQ | 2434.25 | 0.78% | 0.78% | enter | ||||||||||||||||||||||||||||||||||||
| S&P 500 | 1409.71 | -0.61% | -0.61% | enter | ||||||||||||||||||||||||||||||||||||
1The Market Signal is derived from our proprietary
market model. The market model is described on the site. 2The site also shows industry rankings based on fundamentals, combined technical and fundamentals, and on price alone (similar to IBD). The site also shows daily industry movements. |
||||||||||||||||||||||||||||||||||||||||
# of Breakouts
|
Period Average1
|
Max. Gain During Period2
|
Gain at Period Close3
|
|
|---|---|---|---|---|
| This Week | 12 | 30.54 | 1.08% | -5.36% |
| Last Week | 12 | 35.31 | 2.97% | -0.72% |
| 13 Weeks | 440 | 35.85 | 13.21% |
3.31% |
Sector
|
Industry
|
Breakout Count for Week
|
|---|---|---|
BANKING
|
Regional - Southwest Banks
|
1
|
BANKING
|
Regional - Mid-Atlantic Banks
|
1
|
COMPUTER SOFTWARE & SERVICES
|
Technical & System Software
|
1
|
DIVERSIFIED SERVICES
|
Research Services
|
1
|
ENERGY
|
Oil & Gas Pipelines
|
1
|
FINANCIAL SERVICES
|
Closed-End Fund - Equity
|
1
|
FINANCIAL SERVICES
|
Closed-End Fund - Debt
|
1
|
FOOD & BEVERAGE
|
Farm Products
|
1
|
METALS & MINING
|
Aluminum
|
1
|
RETAIL
|
Grocery Stores
|
1
|
RETAIL
|
Catalog & Mail Order Houses
|
1
|
WHOLESALE
|
Drugs Wholesale
|
1
|
2This represents the return if each stock were bought at its breakout price and sold at its intraday high.
3This represents the return if each stock were bought at its breakout price and sold at the most recent close.
Category |
Symbol |
Company Name |
Expected Gain1 |
|---|---|---|---|
| Best Overall | ATML | Atmel Corp | 91 |
| Top Technical | CDMS | Cadmus Communications Cp | 14 |
| Top Fundamental | WRLD | World Acceptance Corp | 25 |
| Top Tech. & Fund. | WRLD | World Acceptance Corp | 25 |
Category |
Symbol |
Company Name |
Expected Gain1 |
|---|---|---|---|
| Best Overall | CRESY | Cresud S.A.C.I.P.Y.A Adr | 42 |
| Top Technical | CRESY | Cresud S.A.C.I.P.Y.A Adr | 42 |
| Top Fundamental | ICLR | Icon Plc Ads | 35 |
| Top Tech. & Fund. | ICLR | Icon Plc Ads | 35 |
If you received this newletter from a friend and you would like to receive it regularly please go to the BreakoutWatch.com site and enter as a Guest. You will then be able to register to receive the newsletter.
Copyright © 2007 NBIcharts, LLC dba BreakoutWatch.com. All rights reserved.
" BreakoutWatch," the BreakoutWatch.com "eye" logo, and the slogan "tomorrow's breakouts today" are service marks of NBIcharts LLC. All other marks are the property of their respective owners, and are used for descriptive purposes only.