| Market Summary | Weekly Breakout Report | Top Breakout Choices | Top 2nd Chances | New Features | Tip of the Week |
Market Summary
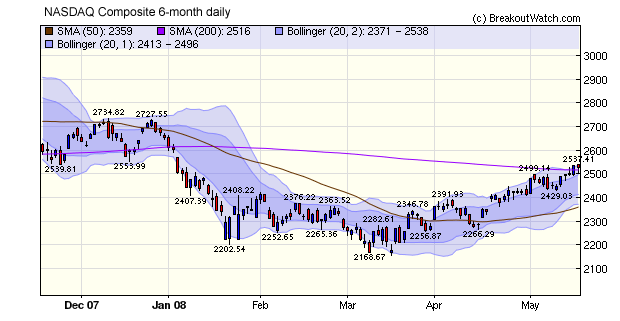
Nasdaq Market Signal Switches to 'Enter'
Because the NASDAQ is more volatile than the DJI and S&P 500, our market model is very conservative about when to recommend re-entering the market. To avoid false signals and subsequent whip-lashing, the model requires that the index be above its 200-day moving average before declaring a follow through day. That hurdle was overcome this week and our model signaled an 'enter'. That resistance point now becomes a support level and it was tested on Friday following the release of the housing data, but recovered to close above the 200 dma.
We continue to be cautious about the rally because the signs are that the economy is continuing to weaken despite the bullish spin put on Friday's housing starts numbers. A more sanguine view was presented on Barry Ritholz's blog where he asked the question "Does this look like a bottom to you?". If you look at the chart he presents I think you'll agree that the housing crisis still has further to go and its effects will continue to be painful on main street. The mortgage banks and other Wall Street players are backstopped by the Fed, which continues to expand the money supply, so we repeat the view we expressed two weeks ago that the market's will continue rise. However, there are encouraging signs that there may be help on the way for delinquent homeowners. Nouriel Roubini favors the Frank-Dodd mortgage bailout plan and reports that a broad consensus is emerging among economists of the left and right that something along the lines of Dodd's plan should be enacted. Regardless of one's views on the merits of the plan, if it does come to pass, then the recession will be less deep than it otherwise might have been, which is also positive for equities.
The number of breakouts continues to increase with thirty-nine confirmed this week compared to the three month average of just 21.
Following an attack on our server by hackers we have moved to a new, more powerful hardware platform. The transition was difficult and accounts for why you did not receive a newsletter last week. We worked hard to keep the service operational and there was minimal disruption to daily service and email alerts. Nevertheless regular subscribers have received a 7-day addition to their subscription to compensate for any inconvenience they may have suffered.
No New Features this Week
Get a 14 day free
Trial of our premium 'Platinum' service and TradeWatch.
No Credit Card Required.
Click
Here for 14 Day Free Trial |
| Index | Value | Change Week | Change YTD | Market1 Signal |
||||||||||||||||||||||||||||||||||||
|---|---|---|---|---|---|---|---|---|---|---|---|---|---|---|---|---|---|---|---|---|---|---|---|---|---|---|---|---|---|---|---|---|---|---|---|---|---|---|---|---|
| Dow | 12986.8 | 1.89% | -2.1% | enter | ||||||||||||||||||||||||||||||||||||
| NASDAQ | 2528.85 | 3.41% | -4.65% | enter | ||||||||||||||||||||||||||||||||||||
| S&P 500 | 1425.35 | 2.67% | -2.93% | enter | ||||||||||||||||||||||||||||||||||||
| Russell 2000 | 741.17 | 2.93% | -3.25% | N/A | ||||||||||||||||||||||||||||||||||||
1The Market Signal is derived from our proprietary
market model. The market model is described on the site. 2The site also shows industry rankings based on fundamentals, combined technical and fundamentals, and on price alone (similar to IBD). The site also shows daily industry movements. |
||||||||||||||||||||||||||||||||||||||||
# of Breakouts |
Period Average1 |
Max. Gain During Period2 |
Gain at Period Close3 |
|
|---|---|---|---|---|
| This Week | 39 | 22.23 | 4.51% | 2.24% |
| Last Week | 28 | 20 | 10.09% | 7.01% |
| 13 Weeks | 298 | 23 | 13.17% |
7.06% |
Sector |
Industry |
Breakout Count for Week |
|---|---|---|
TRANSPORTATION |
Shipping |
4 |
TELECOMMUNICATIONS |
Diversified Communication Services |
2 |
BANKING |
Savings & Loans |
1 |
COMPUTER SOFTWARE & SERVICES |
Business Software & Services |
1 |
COMPUTER SOFTWARE & SERVICES |
Healthcare Information Services |
1 |
COMPUTER SOFTWARE & SERVICES |
Information Technology |
1 |
COMPUTER SOFTWARE & SERVICES |
Multimedia & Graphics Software |
1 |
CONSUMER DURABLES |
Electronic Equipment |
1 |
CONSUMER NON-DURABLES |
Packaging & Containers |
1 |
DIVERSIFIED SERVICES |
Technical Services |
1 |
DIVERSIFIED SERVICES |
Education & Training Services |
1 |
DRUGS |
Biotechnology |
1 |
ELECTRONICS |
Semiconductor - Specialized |
1 |
ELECTRONICS |
Scientific & Technical Instruments |
1 |
ELECTRONICS |
Semiconductor - Memory Chips |
1 |
ELECTRONICS |
Semiconductor - Integrated Circuits |
1 |
ENERGY |
Oil & Gas Equipment & Services |
1 |
ENERGY |
Oil & Gas Pipelines |
1 |
ENERGY |
Oil & Gas Drilling & Exploration |
1 |
FINANCIAL SERVICES |
Closed-End Fund - Equity |
1 |
FOOD & BEVERAGE |
Processed & Packaged Goods |
1 |
FOOD & BEVERAGE |
Beverages - Soft Drinks |
1 |
HEALTH SERVICES |
Home Health Care |
1 |
HEALTH SERVICES |
Medical Instruments & Supplies |
1 |
INTERNET |
Internet Service Providers |
1 |
INTERNET |
Internet Software & Services |
1 |
LEISURE |
Restaurants |
1 |
MANUFACTURING |
Industrial Electrical Equipment |
1 |
MANUFACTURING |
Industrial Equipment & Components |
1 |
MATERIALS & CONSTRUCTION |
Heavy Construction |
1 |
METALS & MINING |
Copper |
1 |
METALS & MINING |
Steel & Iron |
1 |
REAL ESTATE |
REIT - Diversified |
1 |
TELECOMMUNICATIONS |
Communication Equipment |
1 |
WHOLESALE |
Basic Materials Wholesale |
1 |
2This represents the return if each stock were bought at its breakout price and sold at its intraday high.
3This represents the return if each stock were bought at its breakout price and sold at the most recent close.
Category |
Symbol |
Company Name |
Expected Gain1 |
|---|---|---|---|
| Best Overall | NLS | Nautilus Group Inc (the) | 117 |
| Top Technical | NETM | Netmanage Inc | 102 |
| Top Fundamental | RICK | Rick's Caberet Intl | 79 |
| Top Tech. & Fund. | AAPL | Apple Computer Inc | 40 |
Category |
Symbol |
Company Name |
Expected Gain1 |
|---|---|---|---|
| Best Overall | MELA | Electro-Optical Sciences Inc | 100 |
| Top Technical | SNHY | Sun Hydraulics Corp | 62 |
| Top Fundamental | BKC | Burger King Holdings Inc | 54 |
| Top Tech. & Fund. | SNHY | Sun Hydraulics Corp | 62 |
If you received this newletter from a friend and you would like to receive it regularly please go to the BreakoutWatch.com site and enter as a Guest. You will then be able to register to receive the newsletter.
Copyright © 2008 NBIcharts, LLC dba BreakoutWatch.com. All rights reserved.
" BreakoutWatch," the BreakoutWatch.com "eye" logo, and the slogan "tomorrow's breakouts today" are service marks of NBIcharts LLC. All other marks are the property of their respective owners, and are used for descriptive purposes only.