| Market Summary | Weekly Breakout Report | Top Breakout Choices | Top 2nd Chances | New Features | Tip of the Week |
Market Summary
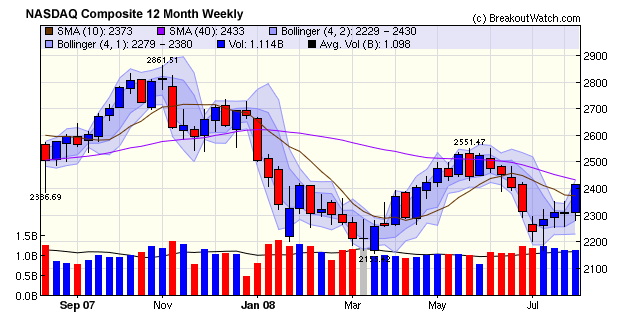
As our Market Summary table (below) shows, the major indexes had a strong week led by the NASDAQ Composite with a 4.5% gain for the week. The weekly chart shows the strength of the upward move compared to other weeks over the last year and is similar to those made in January, March and April. The move this week looks more convincing though for several of reasons:
Volume was above average whereas on the similar move in early April that was not the case.
The volume trend is upwards - surprising as volume is usually lower during the summer weeks.
Commodity prices, particularly oil, have dropped over 20%
The dollar is at last gaining traction. A strong dollar will lower the cost of imported fuel and food and reduce inflation allowing the Fed to keep interest rates low as an economic stimulus.
The index is now above its 50 day moving average although that did not stop it collapsing in June as Fannie and Freddie made headlines. Until the index sustains itself above the 200 dma, then we are reluctant to call the March low as the market bottom.
Another sign of a strengthening market and improving investor confidence that short to medium term gains can be realized is the number of stocks breaking out. The breakout count rose to 52 this week and of these, only three failed to stay above their breakout price by Friday's close. It has been rare lately to see really strong gains on breakout, but five stocks closed the week over 10% higher
| B'out Date | Symbol | Base | B'Out Price | Current % off BOP | *Gain at Intraday High | Expected Gain % |
| 08/07/08 | PRXL | CwH | 29.66 | 20.73% | 20.74% | 51 |
| 08/05/08 | IIVI | CwH | 39.5 | 17.01% | 18.25% | 50 |
| 08/07/08 | HWK | CwH | 19.07 | 15.31% | 17.99% | 50 |
| 08/06/08 | ENSG | CwH | 13.09 | 14.59% | 18.41% | 60 |
| 08/08/08 | ROCK | CwH | 17 | 11.18% | 14.65% | 77 |
Get a 14 day free
Trial of our premium 'Platinum' service and TradeWatch.
No Credit Card Required.
Click
Here for 14 Day Free Trial |
| Index | Value | Change Week | Change YTD | Market1 Signal |
||||||||||||||||||||||||||||||||||||
|---|---|---|---|---|---|---|---|---|---|---|---|---|---|---|---|---|---|---|---|---|---|---|---|---|---|---|---|---|---|---|---|---|---|---|---|---|---|---|---|---|
| Dow | 11734.3 | 3.6% | -11.54% | enter | ||||||||||||||||||||||||||||||||||||
| NASDAQ | 2414.1 | 4.46% | -8.98% | exit | ||||||||||||||||||||||||||||||||||||
| S&P 500 | 1296.31 | 2.86% | -11.72% | enter | ||||||||||||||||||||||||||||||||||||
| Russell 2000 | 734.29 | 2.53% | -4.14% | N/A | ||||||||||||||||||||||||||||||||||||
1The Market Signal is derived from our proprietary
market model. The market model is described on the site. 2The site also shows industry rankings based on fundamentals, combined technical and fundamentals, and on price alone (similar to IBD). The site also shows daily industry movements. |
||||||||||||||||||||||||||||||||||||||||
# of Breakouts |
Period Average1 |
Max. Gain During Period2 |
Gain at Period Close3 |
|
|---|---|---|---|---|
| This Week | 52 | 22.23 | 6.17% | 3.83% |
| Last Week | 37 | 21.38 | 9.58% | 4.38% |
| 13 Weeks | 321 | 24.69 | 10.71% |
-1.13% |
Sector |
Industry |
Breakout Count for Week |
|---|---|---|
DIVERSIFIED SERVICES |
Research Services |
3 |
ELECTRONICS |
Scientific & Technical Instruments |
3 |
HEALTH SERVICES |
Medical Instruments & Supplies |
3 |
COMPUTER SOFTWARE & SERVICES |
Business Software & Services |
2 |
FINANCIAL SERVICES |
Closed-End Fund - Equity |
2 |
HEALTH SERVICES |
Medical Appliances & Equipment |
2 |
HEALTH SERVICES |
Specialized Health Services |
2 |
HEALTH SERVICES |
Long-Term Care Facilities |
2 |
REAL ESTATE |
REIT - Residential |
2 |
AEROSPACE/DEFENSE |
Aerospace/Defense Products & Services |
1 |
BANKING |
Regional - Northeast Banks |
1 |
BANKING |
Regional - Pacific Banks |
1 |
CHEMICALS |
Specialty Chemicals |
1 |
COMPUTER HARDWARE |
Networking & Communication Devices |
1 |
COMPUTER HARDWARE |
Diversified Computer Systems |
1 |
COMPUTER SOFTWARE & SERVICES |
Technical & System Software |
1 |
COMPUTER SOFTWARE & SERVICES |
Information Technology |
1 |
CONSUMER NON-DURABLES |
Textile - Apparel Footwear & Accessories |
1 |
DIVERSIFIED SERVICES |
Management Services |
1 |
DIVERSIFIED SERVICES |
Personal Services |
1 |
DRUGS |
Drug Delivery |
1 |
ELECTRONICS |
Semiconductor - Specialized |
1 |
ELECTRONICS |
Semiconductor - Integrated Circuits |
1 |
HEALTH SERVICES |
Health Care Plans |
1 |
INTERNET |
Internet Software & Services |
1 |
INTERNET |
Internet Information Providers |
1 |
LEISURE |
Restaurants |
1 |
LEISURE |
Specialty Eateries |
1 |
MANUFACTURING |
Small Tools & Accessories |
1 |
MANUFACTURING |
Industrial Electrical Equipment |
1 |
MATERIALS & CONSTRUCTION |
Waste Management |
1 |
MEDIA |
CATV Systems |
1 |
METALS & MINING |
Steel & Iron |
1 |
RETAIL |
Auto Parts Stores |
1 |
RETAIL |
Discount, Variety Stores |
1 |
RETAIL |
Apparel Stores |
1 |
SPECIALTY RETAIL |
Jewelry Stores |
1 |
TELECOMMUNICATIONS |
Communication Equipment |
1 |
TRANSPORTATION |
Trucking |
1 |
2This represents the return if each stock were bought at its breakout price and sold at its intraday high.
3This represents the return if each stock were bought at its breakout price and sold at the most recent close.
Category |
Symbol |
Company Name |
Expected Gain1 |
|---|---|---|---|
| Best Overall | DAIO | Data I/O Corp | 114 |
| Top Technical | RNT | Aaron Rents Inc | 42 |
| Top Fundamental | UNP | Union Pacific Corp | 44 |
| Top Tech. & Fund. | APEI | American Public Education, Inc. | 47 |
Category |
Symbol |
Company Name |
Expected Gain1 |
|---|---|---|---|
| Best Overall | NTCT | Netscout Systems Inc | 90 |
| Top Technical | SXE | Stanley Inc | 51 |
| Top Fundamental | NTES | Netease.com Inc | 58 |
| Top Tech. & Fund. | NTES | Netease.com Inc | 58 |
If you received this newletter from a friend and you would like to receive it regularly please go to the BreakoutWatch.com site and enter as a Guest. You will then be able to register to receive the newsletter.
Copyright © 2008 NBIcharts, LLC dba BreakoutWatch.com. All rights reserved.
" BreakoutWatch," the BreakoutWatch.com "eye" logo, and the slogan "tomorrow's breakouts today" are service marks of NBIcharts LLC. All other marks are the property of their respective owners, and are used for descriptive purposes only.