| Market Summary | Weekly Breakout Report | Top Breakout Choices | Top 2nd Chances | New Features | Tip of the Week |
Special Market Rally Pricing Until July 31 - see below
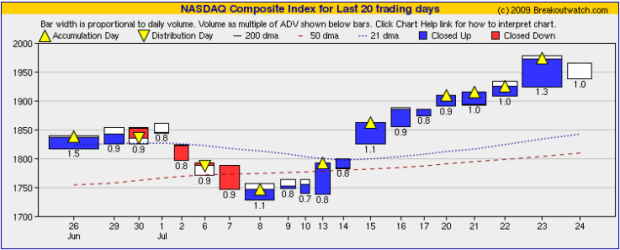
Our equivolume charts provide an excellent visual summary of the state of the major indexes. Published daily in our Market Analysis section they convey at a glance the action for the day and the recent progress of the indexes. Learn more about equivolume charts here.
Our equivolume chart for the NASDAQ over the last 20 sessions shows clearly that more money is coming into the market from the sidelines and driving prices higher. The index closed higher on twelve consecutive days from July 9 until Thursday with seven of those days being accumulation days. (An accumulation day occurs when the volume exceeds that of the previous day). The price rises when demand exceeds supply so we can see from the width of the bars that demand is increasing each day. This can only happen if money is being redistributed from other sources into the market.

After such strong gains, it was not surprising that the index faltered slightly on Friday on profit taking but the white box on the chart shows that the index recovered almost all of its early losses. This shows traders and investors still found value in the shares comprising the index.
Special Market Rally Pricing
For those of you who have been on the sidelines and are thinking of dipping a toe into the market, and for those of you who have stuck with us through thick and thin (thank you!) we have a special offer open until July 31. If you subscribe, renew or upgrade and check the auto-renew box on the subscription page, we will increase the usual auto-renew discount from 5% to 15%. This is a gift that keeps on giving because every renewal thereafter will also get the 15% discount.
Current, returning or new subscribers are eligible for this deal so act today. You only have until midnight Eastern Time on July 31 to take advantage of this offer.
Bonus for Platinum Subscriptions
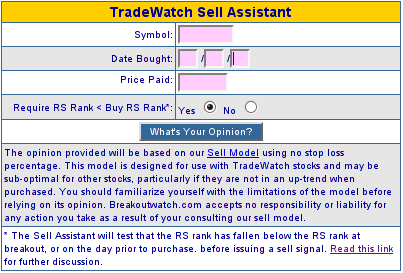
Tradewatch is now automatically included in the Platinum subscription - an extra $39.95 value. This allows Platinum subscribers access to our 'Sell Assistant' even though they may not be interested in our other Tradewatch watchlists. Take advantage of our special offer until July 31 to upgrade to Platinum and get the Sell Assistant, and other Tradewatch services, at an extra discount.
By the way, while we have been promoting the Zacks Strong Buy strategy lately, we failed to mention that Tradewatch has done quite well this year to date. Here are the summary results. Full details are available in the Tradewatch section of the site.
| Buy On Breakout | Buy at Open |
|---|---|
Number of stocks Meeting Criteria: 38 Number of orders filled: 38 Number of failures at 8%: 7 Best Case Results: Avg. gain/loss of positions to highest close: 28.88% Avg. gain/loss including failures: 23.54% |
Number of stocks Meeting Criteria: 37 Number of orders filled: 37 Number of failures at 8%: 15 Best Case Results: Avg. gain/loss of positions to highest close: 20.71% Avg. gain/loss including failures: 12.28% |
Results for Positions Still Open No. of Positions Open: 5 Avg. % Gain on Open Positions: 36.08 Avg. Open Period: 60 days |
Results for Positions Still Open No. of Positions Open: 7 |
Best Performance
VIT 89.9% gain to date |
Best Performance MEDX 99.4% gain to date |
Using The Sell Assistant
Sell Assistant
The Sell Assistant uses our Sell Model (see Sell Model Methodology) to determine if it thinks it is time to sell yet. By completing the form below and clicking the 'What's Your Opinion' button, we will produce a chart of the stock and if the Sell model thinks you should have sold it already, it will annotate the chart with the sell signal date and calculate a return based on the next day's opening price. Note that the Sell Assistant does not use a stop loss figure, but relies on its internal model to determine when to issue a sell signal. The Sell Assistant can be used for any stock, although it is only useful on stocks that were in a confirmed uptrend on the date of purchase.

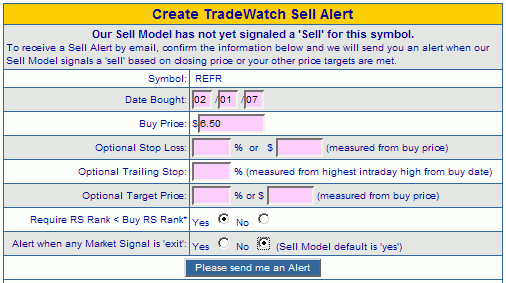
If the Sell Model does not find a sell signal, you can click the 'Create Sell Alert' button and create a sell alert. You now have several options:
- enter a stop loss figure either as a percentage or absolute value of your buy price
- enter a trailing stop percentage, which will trigger an alert if the closing price falls by that percentage from the highest intraday price after the buy date
- enter a target price which will trigger an alert when the stock closes above the target price
- specify if the Sell Assistant is to use RS rank as part of the sell decision process. In this case, the RS rank must be less than the RS rank at purchase for the sell signal to be issued. Specifying 'No' is the more conservative approach, but strong performers will be allowed to run if you answer yes. Read this link for further discussion.
- Override the Sell Assistant's default of sending an alert whenever any market signal goes to 'exit'

Use of the Sell Assistant is now available to all Platinum subscribers.
| Index | Value | Change Week | Change YTD | Trend | ||||||||||||||||||||||||||||||||||||
|---|---|---|---|---|---|---|---|---|---|---|---|---|---|---|---|---|---|---|---|---|---|---|---|---|---|---|---|---|---|---|---|---|---|---|---|---|---|---|---|---|
| Dow | 9093.24 | 3.99% | 3.61% | Down | ||||||||||||||||||||||||||||||||||||
| NASDAQ | 1965.96 | 4.21% | 24.66% | Up | ||||||||||||||||||||||||||||||||||||
| S&P 500 | 979.26 | 4.13% | 8.42% | Down | ||||||||||||||||||||||||||||||||||||
| Russell 2000 | 548.46 | 5.63% | 9.81% | Up | ||||||||||||||||||||||||||||||||||||
| Wilshire 5000 | 10061.5 | 4.43% | 10.72% | Down | ||||||||||||||||||||||||||||||||||||
1The Market Signal is derived from our proprietary
market model. The market model is described on the site. 2The site also shows industry rankings based on fundamentals, combined technical and fundamentals, and on price alone. The site also shows daily industry movements. |
||||||||||||||||||||||||||||||||||||||||
# of Breakouts |
Period Average1 |
Max. Gain During Period2 |
Gain at Period Close3 |
|
|---|---|---|---|---|
| This Week | 19 | 16.15 | 8.86% | 5.85% |
| Last Week | 27 | 16.08 | 12.66% | 8.61% |
| 13 Weeks | 187 | 17.77 | 21.19% |
11.43% |
2This represents the return if each stock were bought at its breakout price and sold at its intraday high.
3This represents the return if each stock were bought at its breakout price and sold at the most recent close.
Category |
Symbol |
Company Name |
Expected Gain1 |
|---|---|---|---|
| Best Overall | RT | RUBY TUESDAY INC | 123 |
| Top Technical | GPRE | Green Plains Renewable Energy | 118 |
| Top Fundamental | TNDM | Neutral Tandem | 65 |
| Top Tech. & Fund. | TNDM | Neutral Tandem | 65 |
Category |
Symbol |
Company Name |
Expected Gain1 |
|---|---|---|---|
| Best Overall | CRNT | Ceragon Networks Ltd | 100 |
| Top Technical | IF | Indonesia Fund | 83 |
| Top Fundamental | PMCS | Pmc-sierra Inc | 93 |
| Top Tech. & Fund. | PMCS | Pmc-sierra Inc | 93 |
If you received this newsletter from a friend and you would like to receive it regularly please go to the BreakoutWatch.com site and enter as a Guest. You will then be able to register to receive the newsletter.
Copyright © 2009 NBIcharts, LLC dba BreakoutWatch.com.
All rights reserved.
"
BreakoutWatch," the BreakoutWatch.com "eye" logo, and the
slogan "tomorrow's breakouts today" are service marks of NBIcharts
LLC. All other marks are the property of their respective owners, and are
used for descriptive purposes only.
BreakoutWatch is not affiliated with Investor's Business Daily or with Mr. William O'Neil.
Our site, research and analysis is supported entirely by subscription and is free from advertising.