| Market Summary | Weekly Breakout Report | Top Breakout Choices | Top 2nd Chances | New Features | Tip of the Week |
Another
brief newsletter this week as we leave Friday afternoon for Lanai to
compete in a road bike race, hopefully without suffering the fate of so
many TdF riders this year.
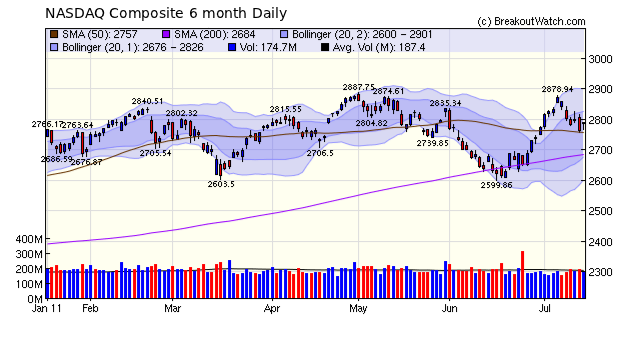
The NASDAQ Composite found support at the 50 dma level on Thursday and moved higher on Friday in response to Google's earnings surprise. This puts a hold on the recent decline, but with uncertainty continuing in Europe and the debt ceiling unresolved at home, it seems likely that consolidation will continue at least until the debt ceiling is raised.
Although the markets may breath a sigh of relief and rally when a deal is finalized, it seems that whatever the outcome of the debt ceiling negotiations, we are in for a minimum $1.5 trillion cut from Government spending. This will have negative effects on the economy in the short term as aggregate demand falls and unemployment increases. The effects of government austerity measures are everywhere to see in Europe where only Germany is on a growth path so I fear the chances of a double-dip recession are increasing.
No new features this week.
This week we answer another subscribers question about the success rate of Head and Shoulders Top (HST) formations. In our newsletter of 6/25/2011 we reported that 73% of confirmed breakdowns from a HST pattern remained below their breakdown price for more than 1 session. Now we look at at what percentage achieve their target price according to Bulkowski's method of determining the target price. (See our HST methodology page). Our database records 3465 successful breakdowns from the HST pattern since we started tracking this data in 2006. By looking at the daily low set in the days following the breakdown, we found that the low met or exceeded the target price 2053 times. That's a success rate of 59%. This success rate conforms quite well with Bulkowski's finding of a 63% success rate. As we noted before, our sample is considerably bigger than his sample of 461 and our time period 7/2006 - 6/2011 is very different from his: mid 1991 to mid 1996. Also our algorithms, each conceived independently, for recognizing the HST pattern would also necessarily be very different. |
| Index | Value | Change Week | Change YTD | Trend | ||||||||||||||||||||||||||||||||||||
|---|---|---|---|---|---|---|---|---|---|---|---|---|---|---|---|---|---|---|---|---|---|---|---|---|---|---|---|---|---|---|---|---|---|---|---|---|---|---|---|---|
| Dow | 12479.7 | -1.4% | 7.79% | Up | ||||||||||||||||||||||||||||||||||||
| NASDAQ | 2789.8 | -2.45% | 5.16% | Up | ||||||||||||||||||||||||||||||||||||
| S&P 500 | 1316.14 | -2.06% | 4.65% | Up | ||||||||||||||||||||||||||||||||||||
| Russell 2000 | 828.78 | -2.79% | 5.76% | Up | ||||||||||||||||||||||||||||||||||||
| Wilshire 5000 | 13941.7 | -2.17% | 4.9% | Up | ||||||||||||||||||||||||||||||||||||
1The Market Signal is derived from our proprietary
market model. The market model is described on the site. 2The site also shows industry rankings based on fundamentals, combined technical and fundamentals, and on price alone. The site also shows daily industry movements. |
||||||||||||||||||||||||||||||||||||||||
# of Breakouts |
Period Average1 |
Max. Gain During Period2 |
Gain at Period Close3 |
|
|---|---|---|---|---|
| This Week | 17 | 12.23 | 4.93% | 2.83% |
| Last Week | 14 | 11.54 | 8.61% | 3.86% |
| 13 Weeks | 185 | 12.62 | 11.03% |
2.01% |
2This represents the return if each stock were bought at its breakout price and sold at its intraday high.
3This represents the return if each stock were bought at its breakout price and sold at the most recent close.
Category |
Symbol |
Company Name |
Expected Gain1 |
|---|---|---|---|
| Best Overall | KOG | Kodiak Oil & Gas Corp. | 113 |
| Top Technical | QLTY | Quality Distribution, Inc. | 62 |
| Top Fundamental | PCLN | priceline.com Incorporated | 38 |
| Top Tech. & Fund. | PCLN | priceline.com Incorporated | 38 |
Category |
Symbol |
Company Name |
Expected Gain1 |
|---|---|---|---|
| Best Overall | CRNT | Ceragon Networks Ltd. | 68 |
| Top Technical | DSCI | Derma Sciences, Inc. | 0 |
| Top Fundamental | JAZZ | Jazz Pharmaceuticals, Inc. | 60 |
| Top Tech. & Fund. | JAZZ | Jazz Pharmaceuticals, Inc. | 60 |
If you received this newsletter from a friend and you would like to receive it regularly please go to the BreakoutWatch.com site and enter as a Guest. You will then be able to register to receive the newsletter.
Copyright © 2011 NBIcharts, LLC dba BreakoutWatch.com.
All rights reserved.
"
BreakoutWatch," the BreakoutWatch.com "eye" logo, and the
slogan "tomorrow's breakouts today" are service marks of NBIcharts
LLC. All other marks are the property of their respective owners, and are
used for descriptive purposes only.
BreakoutWatch is not affiliated with Investor's Business Daily or with Mr. William O'Neil.
Our site, research and analysis is supported entirely by subscription and is free from advertising.