| Market Summary | Weekly Breakout Report | Top Breakout Choices | Top 2nd Chances | New Features | Tip of the Week |
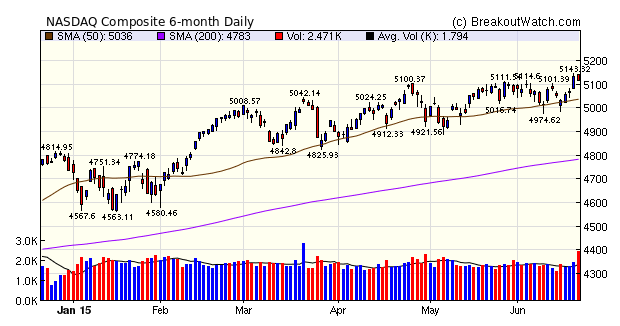
The NASDAQ Composite continues to lead the major indexes with a 1.3% gain for the week and also set a new high on Thursday. It is the only one of the major indexes to maintain a positive trend according to our trend model. Despite heavy volume on Friday as the markets faced a weekend of uncertain moves related to the Greek debt crisis, the NASDAQ gave up just 0.35% compared to 0.58% and 0.56% for the DJI and S&P 500 respectively.
It appears the Greek situation may come to a head next week with a meeting of Euro finance ministers on Monday as Greece will almost certainly default on a debt payment due at the end of the month. I expect Greece will exit the European Union and after a short gasp by the markets, the upward trend will resume.
This week saw the largest number of breakouts we have ever recorded. Nine stocks closed the week with better than 10% gains. Of the nine, 5 were from cup and handle patterns and 4 from volatility squeeze patterns.
| Breakouts for Week Beginning 06/15/15 | |||||||||
| Brkout Date | Symbol | Base | Squeeze | BrkoutOut Price | Brkout Day Close | RS Rank* | Last Close | Current % off BOP | Gain at Intraday High |
|---|---|---|---|---|---|---|---|---|---|
| 06/15/15 | KYTH | CwH | N | 56.43 | 59.75 | 92 | 75 | 32.91 | 32.91 |
| 06/17/15 | RDUS | CwH | N | 49.71 | 51.73 | 99 | 60 | 20.70 | 20.7 |
| 06/18/15 | SQBG | SQZ | Y | 14.26 | 16.08 | 90 | 17 | 19.21 | 19.21 |
| 06/16/15 | POZN | CwH | N | 9.72 | 10.02 | 83 | 11.57 | 19.03 | 19.03 |
| 06/16/15 | ZIOP | SQZ | Y | 10.73 | 10.99 | 98 | 12.14 | 13.14 | 13.98 |
| 06/18/15 | REPH | CwH | N | 11.83 | 13.13 | 98 | 13.4 | 13.27 | 13.27 |
| 06/17/15 | ZIOP | SQZ | Y | 10.97 | 11.57 | 98 | 12.14 | 10.67 | 11.49 |
| 06/19/15 | IPCM | SQZ | Y | 52.31 | 57.82 | 83 | 57.82 | 10.53 | 10.53 |
| 06/15/15 | VDSI | CwH | N | 30.76 | 32.00 | 97 | 33.91 | 10.24 | 10.24 |
| 06/18/15 | SHI | SQZ | Y | 52.21 | 57.22 | 97 | 54.01 | 3.45 | 9.6 |
| 06/16/15 | EVC | CwH | N | 7.54 | 7.62 | 91 | 8.25 | 9.42 | 9.42 |
| 06/15/15 | MGNX | SQZ | Y | 33.98 | 35.36 | 88 | 36.5 | 7.42 | 8.42 |
| 06/18/15 | MDXG | SQZ | Y | 10.46 | 11.32 | 87 | 11.02 | 5.35 | 8.22 |
| 06/18/15 | CDZI | HSB | N | 9.05 | 9.55 | 17 | 9.77 | 7.96 | 7.96 |
| 06/18/15 | ALGT | DB | N | 168.31 | 178.02 | 79 | 179.43 | 6.61 | 6.61 |
| 06/15/15 | PFPT | CwH | N | 62.66 | 63.09 | 93 | 66.49 | 6.11 | 6.38 |
| 06/17/15 | EW | SQZ | Y | 137.97 | 141.6 | 84 | 146.17 | 5.94 | 5.94 |
| 06/16/15 | SONC | SQZ | Y | 31.53 | 31.59 | 86 | 33.36 | 5.80 | 5.8 |
| 06/18/15 | ZLTQ | SQZ | Y | 30.03 | 31.77 | 83 | 31.38 | 4.50 | 5.79 |
| 06/17/15 | SRPT | HTF | N | 28.76 | 29.10 | 97 | 30.35 | 5.53 | 5.53 |
| 06/16/15 | JAKK | CwH | N | 8.51 | 8.85 | 90 | 8.89 | 4.47 | 5.52 |
| 06/17/15 | XON | CwH | N | 47.80 | 48.56 | 96 | 50.27 | 5.17 | 5.17 |
| 06/16/15 | PAYC | SQZ | Y | 36.49 | 38.24 | 96 | 37.71 | 3.34 | 5.12 |
| 06/16/15 | THRM | SQZ | Y | 53.86 | 55.13 | 87 | 56.33 | 4.59 | 5.09 |
| 06/17/15 | NWHM | CwH | N | 15.98 | 15.98 | 80 | 16.77 | 4.94 | 4.94 |
| 06/15/15 | XRM | SQZ | Y | 17.22 | 17.73 | 80 | 17.94 | 4.18 | 4.76 |
| 06/18/15 | HIFR | CwH | N | 32.20 | 33.19 | 85 | 33.72 | 4.72 | 4.72 |
| 06/18/15 | LPCN | SQZ | Y | 7.64 | 7.91 | 81 | 8 | 4.71 | 4.71 |
| 06/18/15 | HQY | CwH | N | 29.28 | 29.38 | 89 | 30.59 | 4.47 | 4.47 |
| 06/17/15 | TYL | SQZ | Y | 123.10 | 124.35 | 83 | 128.5 | 4.39 | 4.39 |
| 06/18/15 | MGNX | CwH | N | 35.36 | 36.84 | 91 | 36.5 | 3.22 | 4.19 |
| 06/15/15 | COT | SQZ | Y | 10.10 | 10.21 | 91 | 10.35 | 2.48 | 4.06 |
| 06/19/15 | JBSS | SQZ | Y | 52.87 | 55 | 95 | 55 | 4.03 | 4.03 |
| 06/18/15 | FLWS | SQZ | Y | 10.30 | 10.71 | 87 | 10.59 | 2.82 | 3.98 |
| 06/19/15 | ITCI | CwH | N | 28.76 | 29.84 | 94 | 29.84 | 3.76 | 3.76 |
| 06/17/15 | MBLY | CwH | N | 52.17 | 54.05 | 81 | 53.28 | 2.13 | 3.6 |
| 06/17/15 | CYBR | CwH | N | 71.35 | 73.89 | 96 | 73.22 | 2.62 | 3.56 |
| 06/17/15 | MMSI | SQZ | Y | 21.13 | 21.57 | 92 | 21.75 | 2.93 | 3.41 |
| 06/15/15 | CFI | SQZ | Y | 28.07 | 28.2 | 92 | 28.58 | 1.82 | 3.35 |
| 06/18/15 | TYL | SQZ | Y | 124.39 | 127.45 | 86 | 128.5 | 3.30 | 3.3 |
| 06/17/15 | ELLI | SQZ | Y | 66.03 | 66.63 | 97 | 68.14 | 3.20 | 3.2 |
| 06/17/15 | CRM | SQZ | Y | 73.38 | 74.42 | 86 | 75 | 2.21 | 3.18 |
| 06/18/15 | MKTX | SQZ | Y | 88.75 | 89.21 | 91 | 91.51 | 3.11 | 3.11 |
| 06/16/15 | CCS | SQZ | Y | 21.04 | 21.28 | 80 | 21.57 | 2.52 | 3.04 |
| 06/17/15 | WWE | CwH | N | 15.97 | 16.45 | 82 | 16.32 | 2.19 | 3.01 |
| 06/17/15 | TGT | SQZ | Y | 80.96 | 82.1 | 82 | 83.35 | 2.95 | 2.95 |
| 06/18/15 | NBIX | CwH | Y | 45.98 | 47.11 | 98 | 47.31 | 2.89 | 2.89 |
| 06/19/15 | NWHM | SQZ | Y | 16.31 | 16.77 | 84 | 16.77 | 2.82 | 2.82 |
| 06/19/15 | VASC | SQZ | Y | 34.54 | 35.46 | 92 | 35.46 | 2.66 | 2.66 |
| 06/18/15 | AMZN | SQZ | Y | 428.09 | 439.39 | 90 | 434.92 | 1.60 | 2.64 |
| 06/18/15 | PBE | CwH | N | 58.40 | 59.83 | 80 | 59.91 | 2.59 | 2.59 |
| 06/18/15 | AMPH | CwH | N | 16.85 | 17.00 | 87 | 17.28 | 2.55 | 2.55 |
| 06/18/15 | IBB | CwH | N | 368.61 | 377.88 | 87 | 377.49 | 2.41 | 2.51 |
| 06/16/15 | IMH | SQZ | Y | 21.10 | 21.62 | 99 | 20.84 | -1.23 | 2.46 |
| 06/19/15 | EXAS | CwH | Y | 28.62 | 29.29 | 91 | 29.29 | 2.34 | 2.34 |
| 06/19/15 | PRSC | SQZ | Y | 51.75 | 52.95 | 84 | 52.95 | 2.32 | 2.32 |
| 06/19/15 | SSNC | SQZ | Y | 63.35 | 64.79 | 85 | 64.79 | 2.27 | 2.27 |
| 06/19/15 | FDEF | SQZ | Y | 35.54 | 36.25 | 82 | 36.25 | 2.00 | 2 |
| 06/17/15 | TSCO | SQZ | Y | 91.13 | 91.73 | 88 | 92.44 | 1.44 | 2 |
| 06/18/15 | KRFT | SQZ | Y | 85.50 | 86.83 | 94 | 87.2 | 1.99 | 1.99 |
| 06/16/15 | MTD | SQZ | Y | 336.66 | 339.41 | 83 | 338 | 0.40 | 1.92 |
| 06/16/15 | GSBC | SQZ | Y | 40.74 | 41.49 | 83 | 41.4 | 1.62 | 1.84 |
| 06/16/15 | ORA | SQZ | Y | 37.64 | 38.06 | 86 | 38.32 | 1.81 | 1.81 |
| 06/17/15 | RDWR | SQZ | Y | 23.98 | 24 | 87 | 24.4 | 1.75 | 1.75 |
| 06/19/15 | FICO | SQZ | Y | 88.97 | 90.33 | 89 | 90.33 | 1.53 | 1.53 |
| 06/18/15 | DIS | SQZ | Y | 111.59 | 113.22 | 83 | 112.62 | 0.92 | 1.46 |
| 06/18/15 | TGT | SQZ | Y | 82.15 | 83.19 | 83 | 83.35 | 1.46 | 1.46 |
| 06/19/15 | GTS | SQZ | Y | 24.65 | 25 | 86 | 25 | 1.42 | 1.42 |
| 06/19/15 | XXIA | SQZ | Y | 13.17 | 13.35 | 82 | 13.35 | 1.37 | 1.37 |
| 06/18/15 | NOC | SQZ | Y | 163.00 | 165.16 | 80 | 165.05 | 1.26 | 1.33 |
| 06/16/15 | ATML | CwH | N | 10.17 | 10.24 | 82 | 10.3 | 1.28 | 1.28 |
| 06/18/15 | HQH | SQZ | Y | 35.70 | 36.15 | 80 | 35.95 | 0.70 | 1.26 |
| 06/19/15 | PRXL | SQZ | Y | 69.72 | 70.6 | 80 | 70.6 | 1.26 | 1.26 |
| 06/19/15 | NEWT | SQZ | Y | 17.78 | 18 | 99 | 18 | 1.24 | 1.24 |
| 06/17/15 | MTD | SQZ | Y | 339.27 | 343.14 | 83 | 338 | -0.37 | 1.14 |
| 06/18/15 | MMSI | SQZ | Y | 21.61 | 21.85 | 93 | 21.75 | 0.65 | 1.11 |
| 06/19/15 | MSFG | CwH | N | 21.78 | 22.02 | 82 | 22.02 | 1.10 | 1.1 |
| 06/15/15 | ALDR | HTF | N | 47.93 | 48.42 | 98 | 46.68 | -2.61 | 1.02 |
| 06/19/15 | FDP | SQZ | Y | 38.54 | 38.93 | 80 | 38.93 | 1.01 | 1.01 |
| 06/17/15 | CWCO | CwH | N | 13.00 | 13.12 | 84 | 12.89 | -0.85 | 0.92 |
| 06/19/15 | LOCK | CwH | N | 16.86 | 17.01 | 81 | 17.01 | 0.89 | 0.89 |
| 06/18/15 | IMPR | CwH | N | 16.15 | 16.28 | 84 | 16.04 | -0.68 | 0.8 |
| 06/19/15 | CYTK | SQZ | Y | 6.46 | 6.51 | 85 | 6.51 | 0.77 | 0.77 |
| 06/19/15 | SCVL | SQZ | Y | 28.43 | 28.61 | 90 | 28.61 | 0.63 | 0.63 |
| 06/18/15 | CRH | CwH | N | 29.25 | 29.26 | 82 | 29.43 | 0.62 | 0.62 |
| 06/19/15 | MTN | SQZ | Y | 107.69 | 108.34 | 85 | 108.34 | 0.60 | 0.6 |
| 06/17/15 | RDN | SQZ | Y | 18.58 | 18.68 | 82 | 18.5 | -0.43 | 0.54 |
| 06/19/15 | TGTX | SQZ | Y | 17.01 | 17.1 | 91 | 17.1 | 0.53 | 0.53 |
| 06/19/15 | WOOF | SQZ | Y | 54.09 | 54.37 | 85 | 54.37 | 0.52 | 0.52 |
| 06/19/15 | GRMN | HSB | Y | 46.61 | 46.84 | 18 | 46.84 | 0.49 | 0.49 |
| 06/19/15 | TREX | SQZ | Y | 51.75 | 51.97 | 90 | 51.97 | 0.43 | 0.43 |
| 06/19/15 | VRTX | SQZ | Y | 127.51 | 128.04 | 89 | 128.04 | 0.42 | 0.42 |
| 06/19/15 | HTLF | CwH | N | 37.03 | 37.17 | 92 | 37.17 | 0.38 | 0.38 |
| 06/19/15 | ASGN | SQZ | Y | 39.73 | 39.87 | 83 | 39.87 | 0.35 | 0.35 |
| 06/19/15 | KRFT | SQZ | Y | 86.93 | 87.2 | 94 | 87.2 | 0.31 | 0.31 |
| 06/18/15 | WX | SQZ | Y | 43.64 | 43.67 | 90 | 43.76 | 0.27 | 0.27 |
| 06/19/15 | HXL | SQZ | Y | 51.53 | 51.63 | 84 | 51.63 | 0.19 | 0.19 |
| 06/18/15 | TCO | HTF | N | 75.21 | 75.34 | 34 | 74.57 | -0.85 | 0.17 |
| 06/19/15 | USNA | SQZ | Y | 136.05 | 136.28 | 95 | 136.28 | 0.17 | 0.17 |
| 06/19/15 | IBB | SQZ | Y | 376.95 | 377.49 | 88 | 377.49 | 0.14 | 0.14 |
| 06/16/15 | SQBK | CwH | N | 28.00 | 28.04 | 87 | 27.59 | -1.46 | 0.14 |
| 06/19/15 | AFH | SQZ | Y | 19.11 | 19.13 | 83 | 19.13 | 0.10 | 0.1 |
| 06/19/15 | HELE | CwH | N | 96.45 | 96.55 | 94 | 96.55 | 0.10 | 0.1 |
| 06/19/15 | OMER | SQZ | Y | 21.04 | 21.06 | 80 | 21.06 | 0.10 | 0.1 |
| 06/19/15 | EROS | CwH | N | 23.42 | 23.44 | 92 | 23.44 | 0.09 | 0.09 |
| 06/19/15 | STMP | SQZ | Y | 72.83 | 72.89 | 96 | 72.89 | 0.08 | 0.08 |
| 06/19/15 | ORLY | SQZ | Y | 229.32 | 229.45 | 89 | 229.45 | 0.06 | 0.06 |
| 06/19/15 | LCI | SQZ | Y | 59.66 | 59.69 | 81 | 59.69 | 0.05 | 0.05 |
| 06/19/15 | LGIH | CwH | Y | 19.13 | 19.14 | 82 | 19.14 | 0.05 | 0.05 |
| 06/19/15 | ADVS | SQZ | Y | 44.19 | 44.2 | 88 | 44.2 | 0.02 | 0.02 |
| Weekly Average (110 breakouts) | 3.26 | 3.7 | |||||||
| *RS Rank on day before breakout. | |||||||||
No new features this week.
Definitive Proof of the Importance of Above Average Volume Before Breakout
Several times recently in this newsletter I've commented on the importance of above average volume on the day before breakout. (see here and here). Those observations were mostly anecdotal so this week I decided to analyze how breakouts with above average volume on the day before breakout really perform.
To do so I looked at all cup and handle pattern breakouts since 2008. This is important because it includes both the worst and best bear and bull markets in most of our lifetimes. It also provided 4584 cases to analyze.
I compared two groups of breakouts:
- Those with above average volume and positive price movement on the day before breakout divided into three groups
- all above average volume
- at least 1.5 times average volume
- at least two times average volume
- Those with below average volume irrespective of price change
I also looked how these two groups performed on the day of breakout, after 7 days and the best close within 30 days of breakout.
| Brkout Day Gain % |
7 Day Gain % |
30 Day Max Gain % |
|
|---|---|---|---|
| Above Avg. Vol. | 5.1 | 4.5 | 12.1 |
| >= 1.5 x Avg. Vol. |
6.5 | 4.9 | 12 |
| >= 2 x Avg. Vol. |
7.7 | 4.7 | 11.7 |
| Below Avg. Vol. |
2.7 | 3 | 11.1 |
It is clear that a positive price move combined with above
average volume significantly improves the short term
performance. Although the advantage is still present over 30
days, it is less distinct.
Conclusion
Above average volume combined with a positive price move the day before breakout substantially improves performance on and after breakout. Use of the "Above average volume" filter will help you find these stocks.
| Index | Value | Change Week | Change YTD | Trend | ||||||||||||||||||||||||||||||||||||
|---|---|---|---|---|---|---|---|---|---|---|---|---|---|---|---|---|---|---|---|---|---|---|---|---|---|---|---|---|---|---|---|---|---|---|---|---|---|---|---|---|
| Dow | 18015.9 | 0.65% | 1.08% | Down | ||||||||||||||||||||||||||||||||||||
| NASDAQ | 5117 | 1.3% | 8.04% | Up | ||||||||||||||||||||||||||||||||||||
| S&P 500 | 2109.99 | 0.76% | 2.48% | Down | ||||||||||||||||||||||||||||||||||||
1The Market Signal is derived
from our proprietary market model. The market model is
described on the site.
2The site also shows industry rankings based on fundamentals, combined technical and fundamentals, and on price alone. The site also shows daily industry movements. |
||||||||||||||||||||||||||||||||||||||||
|
Category
|
Symbol
|
Company Name
|
Expected Gain1
|
|---|---|---|---|
| Best Overall | GLUU | Glu Mobile Inc. | 103 |
| Top Technical | GLUU | Glu Mobile Inc. | 103 |
| Top Fundamental | ILMN | Illumina, Inc. | 24 |
| Top Tech. & Fund. | HRTG | Heritage Insurance Holdings, Inc. | 37 |
|
Category
|
Symbol
|
Company Name
|
Expected Gain1
|
|---|---|---|---|
| Best Overall | JAKK | JAKKS Pacific, Inc. | 82 |
| Top Technical | ITCI | Intra-Cellular Therapies Inc. | 52 |
| Top Fundamental | CYBR | CyberArk Software Ltd. | 49 |
| Top Tech. & Fund. | CYBR | CyberArk Software Ltd. | 49 |
If you received this newsletter from a friend and you would like to receive it regularly please go to the BreakoutWatch.com site and enter as a Guest. You will then be able to register to receive the newsletter.
Copyright © 2015 NBIcharts, LLC dba BreakoutWatch.com. All rights
reserved.
" BreakoutWatch," the BreakoutWatch.com "eye" logo, and the slogan
"tomorrow's breakouts today" are service marks of NBIcharts LLC.
All other marks are the property of their respective owners, and
are used for descriptive purposes only.
BreakoutWatch is not affiliated with Investor's Business Daily or
with Mr. William O'Neil. Our site, research and analysis is
supported entirely by subscription and is free from advertising.