Breakoutwatch Weekly Summary 03/17/18
You are receiving this email because you are or were a BreakoutWatch.com subscriber, or have subscribed to our weekly newsletter. This newsletter summarizes the breakout events of the week and provides additional guidance that does not fit into our daily format. It is published each weekend.
The NASDAQ outperformed the major indexes this week but still lost ground as uncertainty about tariffs, potential trade wars and personnel changes at the White House dominated the headlines. Some of the gains of the previous week were given up but our trend signals still remain positive. Investors need to see some stability in trade and economic policy before the upward trend can resume. While there were a significant number of breakouts, gains were minimal to negative. In an effort to improve your returns, this week I am introducing a "Trailing Stop Calculator" using the upper Average True Range band. See last week's newsletter. 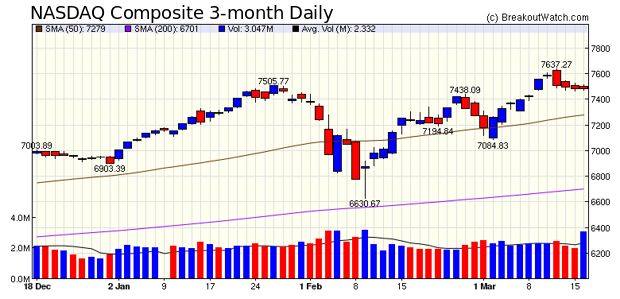 |
| Trailing Stop Calculator This tool is still under development so I offer it in beta test mode. 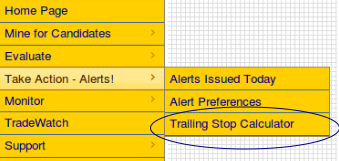 The tool is accessed from the Take Action-Alerts Menu. Its Use is self -explanatory: simply enter a symbol and the buy date and price and the tool will calculate the trailing stop value that you should use for the next trading session. Below is an example of using the calculator to determine the trailing stop for SVG which broke out on Monday this week. 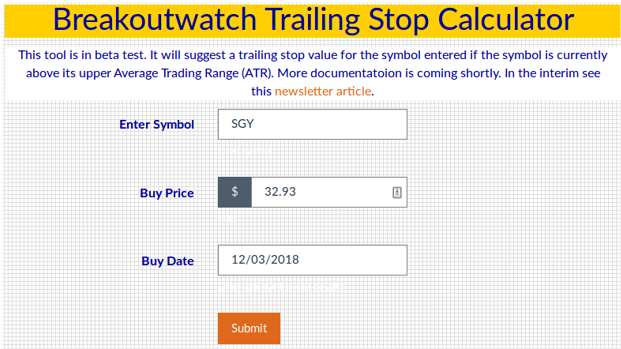 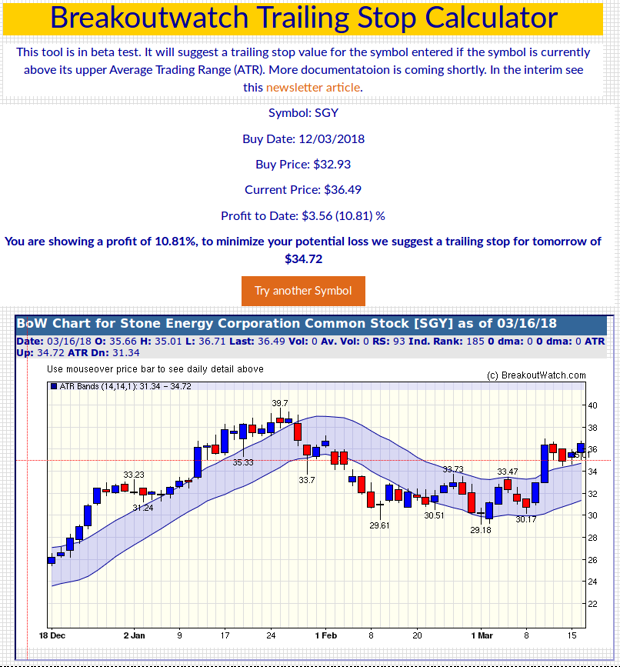 |
|
Our latest strategy
suggestions are here.
|
| List | Breakouts | Avg. Gain |
|---|---|---|
| CWH | 28 | 0.75 |
| SQZ | 65 | 0.63 |
| HTF | 0 | |
| HSB | 0 | |
| DB | 15 | -0.09 |
| Brkout Date | Symbol | Base | Squeeze | BrkoutOut Price | Brkout Day Close | RS Rank* | Last Close | Current % off BOP | Gain at Intraday High |
|---|---|---|---|---|---|---|---|---|---|
| 2018-03-12 | SGY | SQZ | y | 32.93 | 36.36 | 92 | 36.49 | 10.81% | 6.32% |
| 2018-03-12 | BPT | SQZ | y | 21.36 | 21.95 | 80 | 23 | 7.68% | 4.63% |
| 2018-03-12 | ESIO | SQZ | y | 19.79 | 19.85 | 96 | 21.21 | 7.18% | 2.83% |
| 2018-03-13 | CO | SQZ | y | 10.93 | 10.95 | 82 | 11.5 | 5.22% | 3.93% |
| 2018-03-15 | CVTI | DB | n | 30.23 | 32.05 | 76 | 31.8 | 5.19% | 2.08% |
| 2018-03-14 | CO | SQZ | y | 10.96 | 11.15 | 82 | 11.5 | 4.93% | 3.65% |
| 2018-03-13 | CORT | SQZ | y | 17.41 | 17.93 | 82 | 18.26 | 4.88% | 0.69% |
| 2018-03-16 | VHI | CWH | n | 6.63 | 6.95 | 96 | 6.95 | 4.83% | -7.09% |
| 2018-03-13 | BPT | SQZ | y | 21.96 | 22.4 | 81 | 23 | 4.74% | 1.78% |
| 2018-03-15 | WUBA | SQZ | y | 80.47 | 83.4 | 94 | 83.93 | 4.3% | 2.29% |
| 2018-03-14 | MRTN | SQZ | y | 22.91 | 23.1 | 86 | 23.75 | 3.67% | 2.36% |
| 2018-03-15 | SVA | SQZ | y | 8.36 | 8.55 | 84 | 8.65 | 3.47% | 1.2% |
| 2018-03-15 | CO | SQZ | y | 11.16 | 11.4 | 84 | 11.5 | 3.05% | 1.79% |
| 2018-03-14 | RUN | CWH | n | 7.44 | 7.65 | 86 | 7.66 | 2.96% | -0.4% |
| 2018-03-12 | SORL | SQZ | y | 6.61 | 6.75 | 86 | 6.8 | 2.87% | 0.61% |
| 2018-03-15 | MRTN | SQZ | y | 23.11 | 23.65 | 88 | 23.75 | 2.77% | 1.47% |
| 2018-03-12 | CASH | SQZ | y | 113.01 | 116.2 | 88 | 116.1 | 2.73% | 2.03% |
| 2018-03-12 | ITW | DB | y | 167.04 | 169.2 | 72 | 170.96 | 2.35% | 1.59% |
| 2018-03-12 | SAIA | DB | y | 74.60 | 76.3 | 88 | 76.3 | 2.28% | 1.94% |
| 2018-03-16 | MNTA | CWH | n | 18.30 | 18.7 | 80 | 18.7 | 2.19% | -4.04% |
| 2018-03-16 | ALNY | CWH | n | 142.03 | 145.06 | 96 | 145.06 | 2.13% | -2.96% |
| 2018-03-12 | TRU | SQZ | y | 58.03 | 58.5 | 82 | 59.2 | 2.02% | 0.64% |
| 2018-03-16 | MINI | SQZ | y | 44.06 | 44.85 | 92 | 44.85 | 1.79% | -0.02% |
| 2018-03-14 | CORT | SQZ | y | 17.94 | 18.02 | 85 | 18.26 | 1.78% | -2.29% |
| 2018-03-15 | OSBC | CWH | n | 14.70 | 14.75 | 80 | 14.95 | 1.7% | -1.5% |
| 2018-03-12 | CNMD | SQZ | y | 63.32 | 63.48 | 87 | 64.38 | 1.67% | 0.9% |
| 2018-03-16 | WIX | CWH | n | 83.00 | 84.25 | 86 | 84.25 | 1.51% | -0.54% |
| 2018-03-14 | WIX | CWH | n | 83.00 | 83.2 | 85 | 84.25 | 1.51% | -0.54% |
| 2018-03-12 | KNX | SQZ | y | 49.04 | 49.2 | 85 | 49.76 | 1.47% | 0.45% |
| 2018-03-15 | TRU | SQZ | y | 58.36 | 58.65 | 85 | 59.2 | 1.44% | 0.07% |
| 2018-03-15 | CNC | DB | y | 104.15 | 105.24 | 80 | 105.61 | 1.4% | 1.17% |
| 2018-03-16 | CNC | DB | n | 104.15 | 105.61 | 83 | 105.61 | 1.4% | 1.17% |
| 2018-03-16 | TXRH | SQZ | y | 57.94 | 58.7 | 80 | 58.7 | 1.31% | -0.47% |
| 2018-03-13 | MOV | SQZ | y | 31.76 | 31.95 | 80 | 32.15 | 1.23% | 0.13% |
| 2018-03-16 | MVO | SQZ | y | 7.77 | 7.86 | 87 | 7.86 | 1.16% | -1.16% |
| 2018-03-16 | PJT | SQZ | y | 49.28 | 49.85 | 81 | 49.85 | 1.16% | -0.02% |
| 2018-03-13 | KNX | SQZ | y | 49.21 | 49.33 | 85 | 49.76 | 1.12% | 0.1% |
| 2018-03-16 | PCYO | CWH | n | 9.25 | 9.35 | 86 | 9.35 | 1.08% | -1.08% |
| 2018-03-16 | EZPW | SQZ | y | 13.11 | 13.25 | 89 | 13.25 | 1.07% | -0.46% |
| 2018-03-16 | SVA | SQZ | y | 8.56 | 8.65 | 86 | 8.65 | 1.05% | -1.17% |
| 2018-03-12 | GNK | CWH | n | 15.19 | 15.76 | 86 | 15.35 | 1.05% | 0.39% |
| 2018-03-16 | NVMI | SQZ | y | 28.33 | 28.61 | 82 | 28.61 | 0.99% | -0.78% |
| 2018-03-13 | CYRX | CWH | n | 10.07 | 10.08 | 95 | 10.17 | 0.99% | -2.78% |
| 2018-03-16 | STO | SQZ | y | 23.02 | 23.24 | 84 | 23.24 | 0.96% | -0.3% |
| 2018-03-16 | TRU | SQZ | y | 58.66 | 59.2 | 86 | 59.2 | 0.92% | -0.55% |
| 2018-03-12 | KEM | SQZ | y | 19.64 | 19.75 | 89 | 19.81 | 0.87% | 0.31% |
| 2018-03-16 | MTRN | CWH | n | 53.80 | 54.2 | 89 | 54.2 | 0.74% | -0.93% |
| 2018-03-16 | KNX | SQZ | y | 49.40 | 49.76 | 86 | 49.76 | 0.73% | -0.75% |
| 2018-03-15 | TBBK | SQZ | y | 10.91 | 10.95 | 93 | 10.99 | 0.73% | -0.82% |
| 2018-03-16 | NUS | CWH | n | 73.72 | 74.25 | 80 | 74.25 | 0.72% | -1.6% |
| 2018-03-16 | GNK | CWH | n | 15.25 | 15.35 | 86 | 15.35 | 0.66% | -1.57% |
| 2018-03-16 | ALGT | CWH | n | 176.85 | 178 | 81 | 178 | 0.65% | -1.84% |
| 2018-03-15 | LPSN | CWH | n | 15.65 | 15.7 | 93 | 15.75 | 0.64% | -1.28% |
| 2018-03-16 | WUBA | SQZ | y | 83.41 | 83.93 | 95 | 83.93 | 0.62% | -1.32% |
| 2018-03-16 | AA | SQZ | y | 46.94 | 47.23 | 82 | 47.23 | 0.62% | -0.43% |
| 2018-03-16 | MOV | SQZ | y | 31.96 | 32.15 | 82 | 32.15 | 0.59% | -1.28% |
| 2018-03-16 | KEM | CWH | n | 19.70 | 19.81 | 88 | 19.81 | 0.56% | -1.37% |
| 2018-03-16 | ARCB | SQZ | y | 35.31 | 35.5 | 83 | 35.5 | 0.54% | -1.3% |
| 2018-03-16 | BCH | SQZ | y | 101.66 | 102.15 | 84 | 102.15 | 0.48% | -1.15% |
| 2018-03-12 | ALG | SQZ | y | 116.16 | 116.91 | 82 | 116.66 | 0.43% | -0.73% |
| 2018-03-12 | BKI | SQZ | y | 48.51 | 49.05 | 99 | 48.7 | 0.39% | 0.49% |
| 2018-03-16 | MXIM | SQZ | y | 62.38 | 62.62 | 87 | 62.62 | 0.38% | -0.37% |
| 2018-03-16 | MPWR | CWH | n | 124.27 | 124.72 | 81 | 124.72 | 0.36% | -1.05% |
| 2018-03-16 | MPC | CWH | n | 69.43 | 69.68 | 81 | 69.68 | 0.36% | -1.34% |
| 2018-03-13 | KEM | SQZ | y | 19.76 | 19.79 | 90 | 19.81 | 0.25% | -0.3% |
| 2018-03-12 | MPWR | DB | n | 124.44 | 125.51 | 81 | 124.72 | 0.23% | -0.14% |
| 2018-03-16 | RMR | CWH | n | 71.25 | 71.4 | 89 | 71.4 | 0.21% | 0% |
| 2018-03-16 | WRLD | SQZ | y | 110.27 | 110.49 | 95 | 110.49 | 0.2% | -0.81% |
| 2018-03-13 | LII | DB | n | 211.70 | 212.24 | 72 | 212.11 | 0.19% | -0.16% |
| 2018-03-16 | LII | DB | n | 211.70 | 212.11 | 73 | 212.11 | 0.19% | -5.51% |
| 2018-03-14 | LII | DB | n | 211.70 | 212.2 | 73 | 212.11 | 0.19% | -0.6% |
| 2018-03-13 | EDN | SQZ | y | 58.91 | 59.7 | 94 | 59.02 | 0.19% | 0.37% |
| 2018-03-16 | OPB | CWH | y | 29.60 | 29.65 | 84 | 29.65 | 0.17% | -0.68% |
| 2018-03-12 | PAHC | CWH | n | 40.20 | 40.45 | 80 | 40.25 | 0.12% | -0.5% |
| 2018-03-16 | PAHC | CWH | n | 40.20 | 40.25 | 82 | 40.25 | 0.12% | -0.75% |
| 2018-03-16 | URI | CWH | n | 186.11 | 186.29 | 90 | 186.29 | 0.1% | -1.88% |
| 2018-03-12 | LAZ | SQZ | y | 56.08 | 56.82 | 81 | 56.11 | 0.05% | -0.95% |
| 2018-03-12 | BCH | SQZ | y | 102.13 | 102.56 | 86 | 102.15 | 0.02% | -0.6% |
| 2018-03-13 | DPS | SQZ | y | 117.60 | 117.65 | 84 | 117.6 | 0% | -0.03% |
| 2018-03-14 | IGT | CWH | n | 30.00 | 30.74 | 87 | 29.99 | -0.03% | 0.6% |
| 2018-03-12 | HTZ | SQZ | y | 20.40 | 20.47 | 81 | 20.39 | -0.05% | -0.29% |
| 2018-03-12 | SHW | DB | y | 409.58 | 415.25 | 74 | 409.03 | -0.13% | 1.1% |
| 2018-03-12 | BAK | SQZ | y | 29.36 | 29.55 | 86 | 29.31 | -0.17% | 0.41% |
| 2018-03-13 | AIN | CWH | n | 67.15 | 67.3 | 82 | 66.9 | -0.37% | -0.37% |
| 2018-03-14 | PJC | SQZ | y | 87.86 | 87.9 | 87 | 87.5 | -0.41% | -0.81% |
| 2018-03-15 | LRCX | CWH | n | 223.00 | 223.08 | 91 | 221.92 | -0.48% | -0.16% |
| 2018-03-12 | AIT | DB | n | 74.25 | 74.5 | 80 | 73.75 | -0.67% | -0.2% |
| 2018-03-12 | XLRN | SQZ | y | 44.00 | 44.45 | 87 | 43.7 | -0.68% | -0.16% |
| 2018-03-15 | GDEN | SQZ | y | 28.73 | 29.21 | 87 | 28.43 | -1.04% | -0.49% |
| 2018-03-14 | EDN | SQZ | y | 59.71 | 59.99 | 94 | 59.02 | -1.16% | -1.66% |
| 2018-03-12 | HOLI | CWH | y | 27.22 | 27.61 | 89 | 26.85 | -1.36% | -1.87% |
| 2018-03-12 | VRTS | SQZ | y | 134.16 | 134.3 | 80 | 132.05 | -1.57% | -1.57% |
| 2018-03-12 | HLI | SQZ | y | 48.18 | 48.38 | 85 | 47.41 | -1.6% | -0.37% |
| 2018-03-12 | SSD | DB | n | 59.04 | 59.14 | 79 | 58.04 | -1.69% | -0.66% |
| 2018-03-13 | SSD | DB | n | 59.04 | 59.24 | 81 | 58.04 | -1.69% | -0.66% |
| 2018-03-13 | XLRN | SQZ | y | 44.46 | 44.58 | 88 | 43.7 | -1.71% | -1.19% |
| 2018-03-12 | FOLD | SQZ | y | 14.92 | 15.04 | 91 | 14.66 | -1.74% | 0.47% |
| 2018-03-12 | TGS | SQZ | y | 21.64 | 21.73 | 83 | 21.19 | -2.08% | -0.32% |
| 2018-03-14 | EBS | CWH | n | 52.84 | 53.21 | 91 | 51.7 | -2.16% | -0.53% |
| 2018-03-12 | NRT | SQZ | y | 8.63 | 8.66 | 87 | 8.4 | -2.67% | -2.67% |
| 2018-03-12 | FC | SQZ | y | 27.71 | 27.75 | 92 | 26.9 | -2.92% | -1.84% |
| 2018-03-12 | SAGE | SQZ | y | 177.76 | 178.65 | 97 | 172.22 | -3.12% | -1.27% |
| 2018-03-12 | EVR | DB | y | 97.70 | 99.05 | 82 | 94.25 | -3.53% | -0.56% |
| 2018-03-13 | OEC | SQZ | y | 28.56 | 28.6 | 89 | 27.5 | -3.71% | -0.63% |
| 2018-03-12 | TTWO | DB | n | 115.44 | 115.74 | 89 | 107.29 | -7.06% | -1.33% |
| 2018-03-13 | RVNC | SQZ | y | 33.71 | 34.1 | 86 | 31 | -8.04% | -0.33% |
| 2018-03-12 | XNET | SQZ | y | 13.95 | 14.3 | 99 | 12.78 | -8.39% | 0.36% |
| 2018-03-13 | KINS | SQZ | y | 20.36 | 21 | 83 | 17.4 | -14.54% | 3.05% |
| *RS Rank on day before breakout. | |||||||||
| Symbol | BO Price |
BO Vol. |
Company | Industry | RS Rank |
Last Close |
|---|---|---|---|---|---|---|
| SPAR | 18.35 | 369,936 | Spartan Motors - Inc. - Common Stock | Trucks & Other Vehicles | 95 | 16.75 |
| QDEL | 49.63 | 504,264 | Quidel Corporation - Common Stock | Diagnostic Substances | 95 | 48.59 |
| These stocks meet our suggested screening factors
for our Cup and Handle Chart Pattern watchlist. See Revised Rules for Trading Cup and Handle Breakouts |
||||||
| Index | Value | Change Week | Change YTD | Trend1 |
|---|---|---|---|---|
| Dow | 24946.5 |
-1.54% | 0.92% | Up |
| NASDAQ | 7481.99 |
-1.04% | 8.38% | Up |
| S&P 500 | 2752.01 |
-1.24% | 2.93% | Up |
|
1The Market Trend is derived from
our proprietary market model. The market model is described on
the site here.
2The site also shows industry rankings based on fundamentals, combined technical and fundamentals, and on price alone. The site also shows daily industry movements. |
||||
| 1 Week | 13 Weeks | 26 Weeks | Year-to-Date |
|---|---|---|---|
| NASDAQ Composite |
NASDAQ Composite 7.86 % |
NASDAQ Composite 16.03 % |
NASDAQ Composite 8.38 % |
| 1 Week | 3 Weeks | 13 Weeks | 26 Weeks |
|---|---|---|---|
| Manufactured Housing |
Gaming Activities |
Auto Parts Wholesale |
Resorts & Casinos |
| Meat Products 124 |
Manufactured Housing 213 |
Manufactured Housing 205 |
Wholesale - Other 215 |
| Charts of each industry rank and performance over 12 months are available on the site | |||
If you received this newsletter from a friend and you would like to receive it regularly please go to the BreakoutWatch.com site and you will then be able to register to receive the newsletter.
Copyright (c) 03/17/2018 NBIcharts, LLC dba BreakoutWatch.com. All
rights reserved.
" BreakoutWatch," the BreakoutWatch.com "eye" logo, and the slogan
"tomorrow's breakouts today" are service marks of NBIcharts LLC. All
other marks are the property of their respective owners, and are used
for descriptive purposes only.
BreakoutWatch is not affiliated with Investor's Business Daily or with Mr. William O'Neil. Our site, research and analysis is supported entirely by subscription and is free from advertising.