Breakoutwatch Weekly Summary 02/18/2023
You are receiving this email because you are or were a
BreakoutWatch.com subscriber, or have subscribed to our weekly
newsletter.
To read this newsletter on the site, click here: Newsletter
.
Market Summary
Stocks end mixed on data surprises
The major indexes ended mixed as investors weighed some healthy growth and profit signals against worries that inflation trends might be taking an unfavorable turn. Fears that the Federal Reserve would need to raise short-term interest rates more than previously expected caused U.S. Treasury yields to increase and fostered a rise in the U.S. dollar, taking an especially large toll on oil prices and energy stocks. (Oil is priced in U.S. dollars on international markets, resulting in pressure on demand when the dollar appreciates.) T. Rowe Price traders noted that trading volumes were especially subdued at the start of the week following Sunday’s Super Bowl celebrations, and markets were scheduled to be closed on Monday, February 20, in observance of the Presidents’ Day holiday. [more...]
Major Index Performance
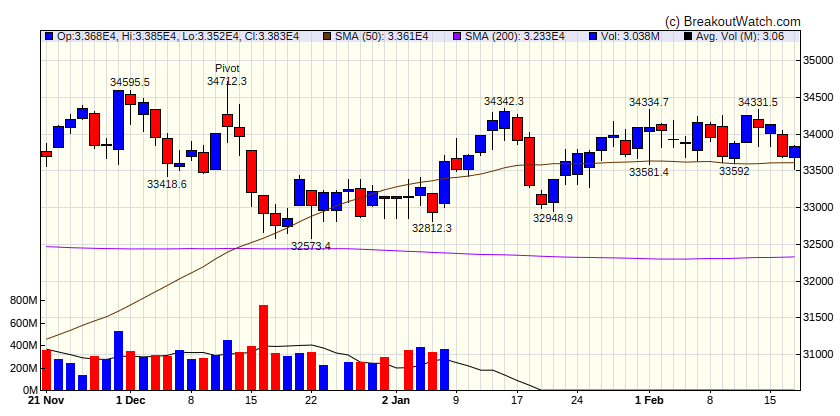
| Dow Jones
|
| Last Close
| 33826.7 |
| Wk. Gain
| -0.18 % |
| Yr. Gain
| 2.13 % |
| Trend
| Up |
|
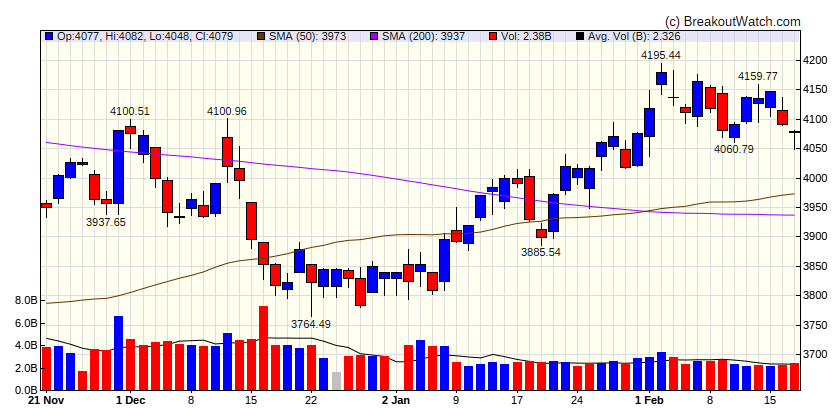
| S&P 500
|
| Last Close
| 4079.09 |
| Wk. Gain
| -0.43 % |
| Yr. Gain
| 6.53 % |
| Trend
| Up |
|
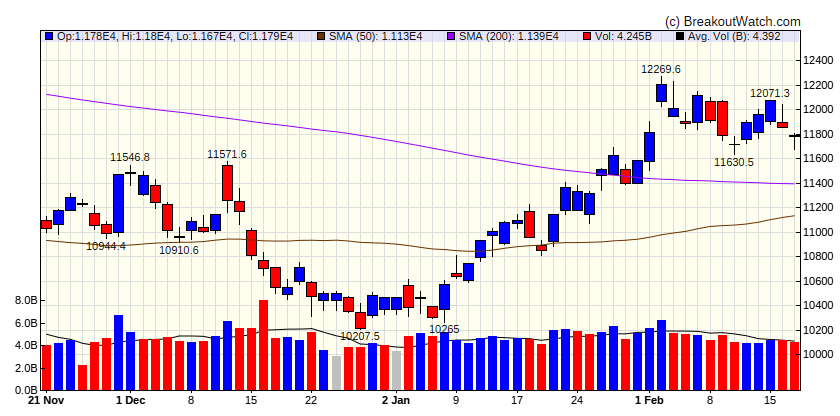
| NASDAQ Comp.
|
| Last Close
| 11787.3 |
| Wk. Gain
| 0.24 % |
| Yr. Gain
| 13.68 % |
| Trend
| Up |
|
| Russell 2000
|
| Last Close
| 1946.36 |
| Wk. Gain
| 1.38 % |
| Yr. Gain
| 9.98 % |
| Trend
| Up |
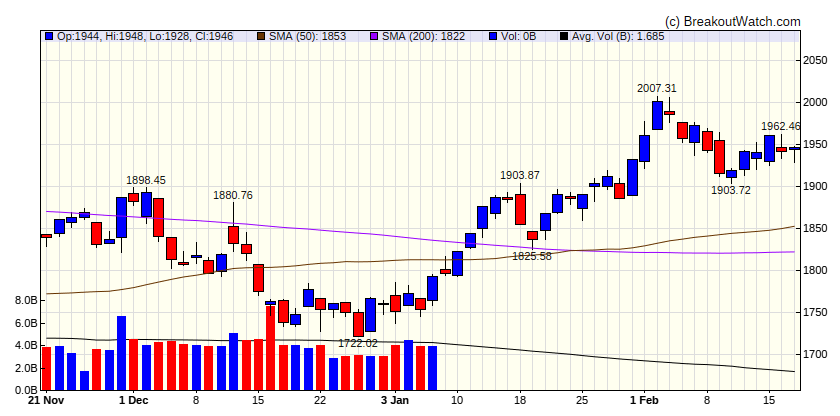
|
Performance by Sector
| Sector |
Wk. Change % |
Yr. Change % |
Trend |
| Consumer Discretionary |
1.9 |
17.56 |
Up |
| Consumer Staples |
0.91 |
-0.28 |
Up |
| Energy |
-5.7 |
-2.07 |
Down |
| Finance |
0.02 |
8.13 |
Up |
| Health Care |
0.06 |
-1.41 |
Down |
| Industrials |
1.04 |
7.51 |
Up |
| Technology |
-0.62 |
14 |
Up |
| Materials |
-0.25 |
6.3 |
Down |
| REIT |
-1.12 |
8.11 |
Down |
| Telecom |
0.51 |
16.21 |
Down |
| Utilities |
1.15 |
-3.32 |
Down |
Breakouts This Week Still Within 5% of Breakout Price (Limit 20 top C Score)
| Watchlist |
Symbol |
Company |
Industry |
C Score* |
% Gain |
| SQZ |
SXC |
SunCoke Energy, Inc. |
Coking Coal |
85 % |
1.9 % |
| CWH |
JXN |
Jackson Financial Inc. |
Insurance - Life |
80.7 % |
3.4 % |
| CWH |
INT |
World Fuel Services Corporation |
Oil & Gas Refining & Marketing |
80.1 % |
0.7 % |
| SQZ |
MYE |
Myers Industries, Inc. |
Packaging & Containers |
79.2 % |
4.9 % |
| SQZ |
SPSC |
SPS Commerce, Inc. |
Software - Infrastructure |
79.2 % |
4.3 % |
| SQZ |
PAGP |
Plains GP Holdings, L.P. |
Oil & Gas Midstream |
78.8 % |
0.1 % |
| CWH |
IMXI |
International Money Express, Inc. |
Software - Infrastructure |
78.6 % |
0.6 % |
| CWH |
ELA |
Envela Corporation |
Luxury Goods |
78.4 % |
4.9 % |
| SQZ |
VMI |
Valmont Industries, Inc. |
Conglomerates |
78.4 % |
0.9 % |
| CWH |
HTH |
Hilltop Holdings Inc. |
Banks - Regional |
78.1 % |
1 % |
| SQZ |
EME |
EMCOR Group, Inc. |
Engineering & Construction |
77.4 % |
1.7 % |
| CWH |
WING |
Wingstop Inc. |
Restaurants |
77.3 % |
2.7 % |
| SQZ |
EDAP |
EDAP TMS S.A. |
Medical Devices |
76.6 % |
4 % |
| SQZ |
AMR |
Alpha Metallurgical Resources, Inc. |
Coking Coal |
75.5 % |
2.6 % |
| CWH |
COTY |
Coty Inc. |
Household & Personal Products |
74.7 % |
4.4 % |
| SQZ |
WEN |
Wendy's Company (The) |
Restaurants |
74.6 % |
1.2 % |
| SQZ |
JAKK |
JAKKS Pacific, Inc. |
Leisure |
74.2 % |
3.2 % |
| CWH |
ATEC |
Alphatec Holdings, Inc. |
Medical Devices |
73.8 % |
0.1 % |
| SQZ |
STVN |
Stevanato Group S.p.A. Or |
Medical Instruments & Supplies |
73.7 % |
2.7 % |
| CWH |
KAI |
Kadant Inc |
Specialty Industrial Machinery |
73.3 % |
1.6 % |
| *C score is our assessment of a Stock's correlation to CAN SLIM principles. It combines a stock's Technical and Fundamental merits and is expressed as a percentage. |
Breakdowns within 5% of Breakdown Price
| Watchlist |
Symbol |
Company |
Industry |
C Score* |
% Loss |
| SS |
SLB |
Schlumberger N.V. |
Oil & Gas Equipment & Services |
84.3 % |
-1.5 % |
| SS |
CLW |
Clearwater Paper Corporation |
Paper & Paper Products |
69.4 % |
-1.4 % |
| SS |
MRO |
Marathon Oil Corporation |
Oil & Gas E&P |
68.5 % |
-4.4 % |
| SS |
GILD |
Gilead Sciences, Inc. |
Drug Manufacturers - General |
67.6 % |
-1.1 % |
| SS |
FCNCA |
First Citizens BancShares, Inc. |
Banks - Regional |
67 % |
-1.4 % |
| SS |
AJG |
Arthur J. Gallagher & Co. |
Insurance Brokers |
65.2 % |
-2.1 % |
| SS |
CVE |
Cenovus Energy Inc |
Oil & Gas Integrated |
63.9 % |
-4.1 % |
| SS |
FGF |
FG Financial Group, Inc. |
Insurance - Diversified |
62.9 % |
-0.4 % |
| SS |
GLNG |
Golar LNG Limited |
Oil & Gas Midstream |
61.9 % |
-3.6 % |
| SS |
NWBI |
Northwest Bancshares, Inc. |
Banks - Regional |
59.2 % |
-0.1 % |
| SS |
IONS |
Ionis Pharmaceuticals, Inc. |
Biotechnology |
52.8 % |
-1.1 % |
| SS |
SLCA |
U.S. Silica Holdings, Inc. |
Oil & Gas Equipment & Services |
52.8 % |
-4.2 % |
| SS |
RLMD |
Relmada Therapeutics, Inc. |
Biotechnology |
25.3 % |
-0.5 % |
| *C score is our assessment of a Stock's correlation to CAN SLIM principles. It combines a stock's Technical and Fundamental merits and is expressed as a percentage. |
Cup and Handle Stocks Likely to Breakout at Next Session
| Symbol |
BoP |
Company |
Industry |
Within x% of BoP |
C Score* |
| There were no CWH stocks meeting our breakout model criteria |
| *C score is our assessment of a Stock's correlation to CAN SLIM principles. It combines a stock's Technical and Fundamental merits and is expressed as a percentage. |
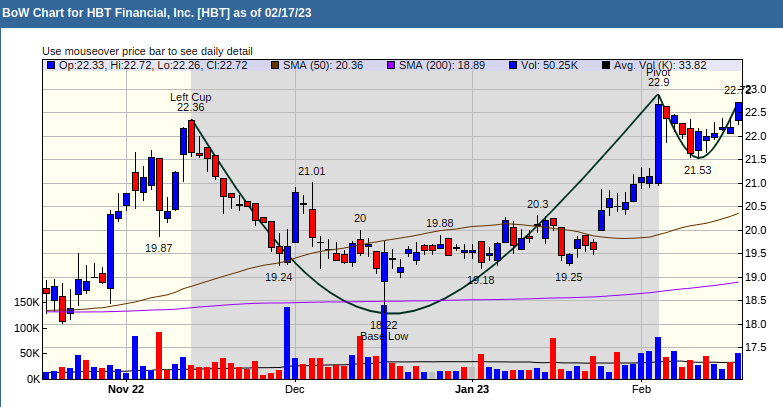
Cup and Handle Chart of the Week
Although there were no stocks selected by our breakout model, HBT Financial was selected by a filter on stocks with highest RS Rank, being under accumulation and having closed on above average volume. HBT shows a healthy handle with accumulation rising after profit taking following the pivot.