| Market Summary | Weekly Breakout Report | Top Breakout Choices | Top 2nd Chances | New Features | Tip of the Week |
Market Summary
Last week we noted that the market had a preference for large cap stocks and explained some of the reasons for that. The trend continued this week with the DJI and S&P 500 making gains of 1.73% and 1.12% respectively but the NASDAQ again lost ground by 0.15%. This was the seventh straight positive week for large cap stocks and the fourth accumulation week out of those seven. In contrast, the NASDAQ suffered its second consecutive weekly loss and volume increased showing that distribution is accelerating. Our market model teetered on again declaring an 'exit' for the NASDAQ but was saved by an accumulation day on Friday. The distribution day count has now fallen back to three in seven days.
The economic news this week continued to be contradictory.
- The Conference Board's Index of Leading Economic Indicators declined by much more than expected indicating that the economy may slow more quickly than previously thought. This may be good news for interest rates but if economic activity weakens then employment and consequently consumer spending will decline.
- However, there were no signs of that occurring yet as jobless claims fell for the fifth straight weak. Continuing full employment may account for a higher than expected consumer sentiment rating reported on Friday.
- The number of housing starts in April exceeded expectations, but the number of new building permits dropped sharply showing that the housing market slump is not yet over. This was confirmed by the National Association of Homebuilders which lowered its outlook for housing.
This uncertainty explains why institutional investors are 'dancing close to the door' by emphasizing liquid, large-cap stocks rather than more speculative investments. This trend actually began last November when nervousness about the economy and the impact of the housing market slump began to take hold. This is illustrated by the comparative RS line on the following chart.
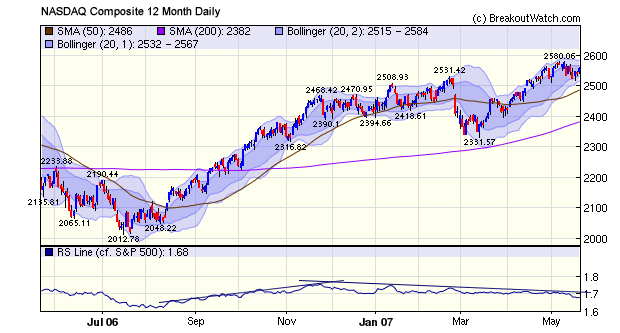
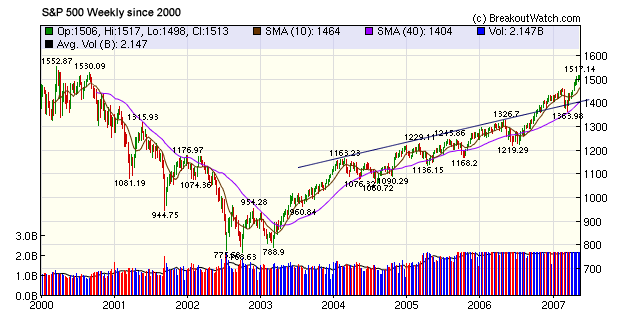
The S&P 500 continues to trade outside its upper trend line and is closing in on its all time high set in March 2000. This will be a strong resistance level and a breakthrough would be a statement that the bull market has further to run.
There were no new features added this week.
Technicals are More Important than Fundamentals when Choosing Breakouts
Since we started our site, we have become increasingly aware that the technical condition of a stock is more important than its fundamentals. We presented evidence confirming this almost two years ago. This week's breakouts provide another example. Of 16 breakouts from a cup-with-handle base, only 4 of them rated a '4' for fundamental strength but all 16 scored a '4' for technical strength according to our CE Zone methodology. The average gain by week's end of those with a '4' for fundamental strength was a healthy 3.93% but the stocks that only scored a '3' for fundamentals did much better with a 5.08% average gain. The table below, adapted from our daily breakout reports, shows the successful CwH breakouts for the week.
The fundamental's of a stock tell you all about the sales, earnings and ROI of a stock over the last few years, and these are a good, although imperfect, guide to what the stock may do in the future. However, the technicals (mainly price and volume recent performance) tell you what the market thinks of the stock now. In other words, the technicals represent the market's view of how it values the fundamentals as a guide to likely future earnings.
Cup-with-Handle Sustained Breakouts
Week Ending 05/18/07 |
||||||||
|---|---|---|---|---|---|---|---|---|
| B'out Date |
Symbol | B'Out Price |
B'out Day Close |
B'out Vol % ADV |
B'out CE Cell |
Last Close |
Current % off BOP |
*Gain at Intraday High |
| 05/18/07 | PRX | 28.10 | 28.30 | 382.82 | 4-3 | 28.3 | 0.71% | 5.34% |
| 05/18/07 | EDO | 32.21 | 32.45 | 161.99 | 4-3 | 32.45 | 0.75% | 0.84% |
| 05/18/07 | DK | 22.43 | 23.48 | 381.59 | 4-3 | 23.48 | 4.68% | 5.22% |
| 05/18/07 | CPX | 26.31 | 26.72 | 177.53 | 4-4 | 26.72 | 1.56% | 2.62% |
| 05/17/07 | SGR | 36.41 | 36.69 | 161.08 | 4-3 | 36.88 | 1.29% | 3.05% |
| 05/17/07 | OMNI | 10.45 | 10.96 | 451.98 | 4-4 | 11.23 | 7.46% | 8.61% |
| 05/17/07 | HHGP | 20.25 | 20.67 | 232.00 | 4-3 | 21.3 | 5.19% | 5.73% |
| 05/17/07 | CTRP | 73.46 | 78.07 | 653.67 | 4-3 | 79.48 | 8.19% | 8.77% |
| 05/16/07 | TW | 21.79 | 21.80 | 247.48 | 4-2 | 21.79 | 0.00% | 0.87% |
| 05/16/07 | ONXX | 31.28 | 31.30 | 152.95 | 4-2 | 31.53 | 0.80% | 3.58% |
| 05/16/07 | IHG | 25.96 | 27.20 | 474.17 | 4-3 | 27 | 4.01% | 6.86% |
| 05/16/07 | IBN | 46.94 | 47.66 | 299.74 | 4-3 | 47.85 | 1.94% | 2.56% |
| 05/16/07 | CPA | 65.17 | 67.89 | 236.83 | 4-4 | 65.93 | 1.17% | 8.85% |
| 05/15/07 | PSMT | 18.39 | 18.86 | 202.82 | 4-4 | 19.73 | 7.29% | 7.83% |
| 05/14/07 | JBX | 71.62 | 73.88 | 334.30 | 4-3 | 75.7 | 5.70% | 11.06% |
| 05/14/07 | HHGP | 19.29 | 19.48 | 158.67 | 4-3 | 21.3 | 10.42% | 10.99% |
| Average Gain | 3.82% |
5.80% |
||||||
Investment Advisors Using our Service
TradeRight Securities, located in a suburb of Chicago, is a full services investment management company and broker/dealer. They have been a subscriber, and user, of BreakoutWatch.com for some time now. They practice CANTATA and use Breakoutwatch.com as a “research analyst”. You can learn more about TradeRight Securities at: www.traderightsecurities.com. If you’re interested in speaking to a representative, simply call them toll-free at 1-800-308-3938 or e-mail gdragel@traderightsecurities.com.
PivotPoint Advisors, LLC takes a technical approach to investment planning and management. A breakoutwatch.com subscriber since May, 2004, they use breakouts, market signals, and now TradeWatch to enhance returns for their clients. Learn more at http://pivotpointadvisors.net or contact John Norquay at 608-826-0840 or by email at john.norquay@pivotpointadvisors.net.
Note to advisors: If you would like to be listed here, please contact us. As a service to those who subscribe to us, there is no additional charge to be listed here.
| Get a 14 day Trial of
our premium 'Platinum' service and TradeWatch for just $9.95 and
if you subsequently subscribe to any subscription
level we will credit your $9.95 to your subscription.
14
Day Platinum Trial |
| Index | Value | Change Week | Change YTD | Market1 Signal |
||||||||||||||||||||||||||||||||||||
|---|---|---|---|---|---|---|---|---|---|---|---|---|---|---|---|---|---|---|---|---|---|---|---|---|---|---|---|---|---|---|---|---|---|---|---|---|---|---|---|---|
| Dow | 13556.5 | 1.73% | 8.77% | enter | ||||||||||||||||||||||||||||||||||||
| NASDAQ | 2558.45 | -0.15% | 5.93% | enter | ||||||||||||||||||||||||||||||||||||
| S&P 500 | 1522.75 | 1.12% | 7.36% | enter | ||||||||||||||||||||||||||||||||||||
1The Market Signal is derived from our proprietary
market model. The market model is described on the site. 2The site also shows industry rankings based on fundamentals, combined technical and fundamentals, and on price alone (similar to IBD). The site also shows daily industry movements. |
||||||||||||||||||||||||||||||||||||||||
# of Breakouts
|
Period Average1
|
Max. Gain During Period2
|
Gain at Period Close3
|
|
|---|---|---|---|---|
| This Week | 24 | 18.46 | 2.82% | 0.24% |
| Last Week | 17 | 18.92 | 9.4% | 3.19% |
| 13 Weeks | 301 | 20.15 | 11.9% |
2.95% |
Sector
|
Industry
|
Breakout Count for Week
|
|---|---|---|
ENERGY
|
Oil & Gas Equipment & Services
|
2
|
FINANCIAL SERVICES
|
Closed-End Fund - Debt
|
2
|
FINANCIAL SERVICES
|
Closed-End Fund - Equity
|
2
|
AEROSPACE/DEFENSE
|
Aerospace/Defense Products & Services
|
1
|
BANKING
|
Foreign Money Center Banks
|
1
|
BANKING
|
Regional - Mid-Atlantic Banks
|
1
|
DIVERSIFIED SERVICES
|
Staffing & Outsourcing Services
|
1
|
DRUGS
|
Drugs - Generic
|
1
|
DRUGS
|
Biotechnology
|
1
|
ELECTRONICS
|
Semiconductor Equipment & Materials
|
1
|
ENERGY
|
Oil & Gas Refining & Marketing
|
1
|
INSURANCE
|
Property & Casualty Insurance
|
1
|
LEISURE
|
Resorts & Casinos
|
1
|
LEISURE
|
Lodging
|
1
|
LEISURE
|
Restaurants
|
1
|
MANUFACTURING
|
Industrial Equipment & Components
|
1
|
MATERIALS & CONSTRUCTION
|
Waste Management
|
1
|
REAL ESTATE
|
REIT - Retail
|
1
|
RETAIL
|
Discount, Variety Stores
|
1
|
TRANSPORTATION
|
Regional Airlines
|
1
|
2This represents the return if each stock were bought at its breakout price and sold at its intraday high.
3This represents the return if each stock were bought at its breakout price and sold at the most recent close.
Category |
Symbol |
Company Name |
Expected Gain1 |
|---|---|---|---|
| Best Overall | GVP | Gse Systems Inc | 99 |
| Top Technical | CCC | Calgon Carbon Corp | 57 |
| Top Fundamental | HURN | Huron Consulting Group Inc | 39 |
| Top Tech. & Fund. | THE | Todco | 16 |
Category |
Symbol |
Company Name |
Expected Gain1 |
|---|---|---|---|
| Best Overall | DK | Delek US Holdings Inc | 49 |
| Top Technical | EDO | Edo Corp | 23 |
| Top Fundamental | CPX | Complete Production Services Inc | 21 |
| Top Tech. & Fund. | CPX | Complete Production Services Inc | 21 |
If you received this newletter from a friend and you would like to receive it regularly please go to the BreakoutWatch.com site and enter as a Guest. You will then be able to register to receive the newsletter.
Copyright © 2007 NBIcharts, LLC dba BreakoutWatch.com. All rights reserved.
" BreakoutWatch," the BreakoutWatch.com "eye" logo, and the slogan "tomorrow's breakouts today" are service marks of NBIcharts LLC. All other marks are the property of their respective owners, and are used for descriptive purposes only.