| Market Summary | Weekly Breakout Report | Top Breakout Choices | Top 2nd Chances | New Features | Tip of the Week |
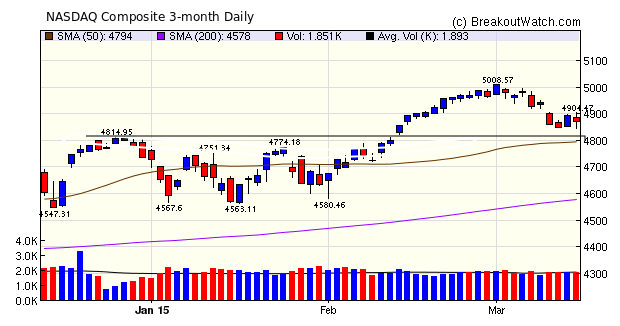
Twin fears roiled the markets this week. Investors worried that the Fed may announce a change in interest rate policy at next weeks Open Markets Committee meeting and the rising dollar compared to all international currencies, particularly the Euro, threatens profits for companies with global interests. As a result our market trend signals for the large cap indexes, DJI and S&P 500, turned negative this week. The NASDAQ trend signal remains positive. The NASDAQ moved sideways this week as can be seen from the chart below and remains above its primary support level at 4814 and also the 50 day moving average.
Despite the sideways movement, the number of breakouts held steady with 24 this week compared to 25 last week. Only 4 stocks were below their breakout price at Friday's close and the average gain for the week improved from 1.2% to 2.7%.
| Breakouts for Week Beginning 03/09/15 | |||||||||
| Brkout Date | Symbol | Base | Squeeze | BrkoutOut Price | Brkout Day Close | RS Rank* | Last Close | Current % off BOP | Gain at Intraday High |
|---|---|---|---|---|---|---|---|---|---|
| 03/12/15 | EGRX | HTF | N | 38.98 | 45.37 | 99.00 | 46.09 | 18.24 | 18.24 |
| 03/10/15 | HPTX | CwH | N | 30.17 | 32.82 | 88.00 | 35.12 | 16.41 | 17.1 |
| 03/11/15 | SLXP | CwH | N | 158.01 | 168.61 | 95.00 | 169.4 | 7.21 | 7.62 |
| 03/12/15 | OLED | CwH | N | 38.87 | 40.09 | 92.00 | 41.63 | 7.10 | 7.1 |
| 03/10/15 | OTIC | CwH | N | 37.08 | 39.48 | 95.00 | 39.36 | 6.15 | 6.47 |
| 03/11/15 | CRESY | CwH | N | 12.50 | 12.50 | 84.00 | 13.06 | 4.48 | 5.76 |
| 03/09/15 | UTIW | CwH | N | 13.24 | 13.92 | 80.00 | 13.38 | 1.06 | 5.14 |
| 03/09/15 | AIR | CwH | N | 31.55 | 31.98 | 83.00 | 32.99 | 4.56 | 4.56 |
| 03/11/15 | PLOW | CwH | N | 23.03 | 23.78 | 84.00 | 22.74 | -1.26 | 3.26 |
| 03/13/15 | GHDX | SQZ | Y | 32.58 | 33.45 | 74.00 | 33.45 | 2.67 | 2.67 |
| 03/13/15 | MAC | CwH | N | 92.76 | 94.39 | 93.00 | 94.39 | 1.76 | 1.76 |
| 03/12/15 | BSFT | CwH | N | 33.07 | 33.40 | 90.00 | 33.64 | 1.72 | 1.72 |
| 03/12/15 | DG | CwH | N | 73.09 | 74.28 | 81.00 | 74.3 | 1.66 | 1.66 |
| 03/13/15 | SBNY | SQZ | Y | 129.33 | 131.32 | 70.00 | 131.32 | 1.54 | 1.54 |
| 03/11/15 | BNO | HSB | N | 21.32 | 21.64 | 5.00 | 20.39 | -4.36 | 1.5 |
| 03/13/15 | XNPT | SQZ | Y | 7.43 | 7.51 | 87.00 | 7.51 | 1.08 | 1.08 |
| 03/13/15 | PGNX | CwH | N | 7.03 | 7.09 | 91.00 | 7.09 | 0.85 | 0.85 |
| 03/11/15 | STM | CwH | N | 9.37 | 9.43 | 81.00 | 9.21 | -1.71 | 0.64 |
| 03/09/15 | MERC | CwH | Y | 14.42 | 14.51 | 94.00 | 13.94 | -3.33 | 0.62 |
| 03/12/15 | SMP | CwH | N | 42.61 | 42.82 | 80.00 | 41.87 | -1.74 | 0.49 |
| 03/13/15 | SANM | SQZ | Y | 23.84 | 23.93 | 71.00 | 23.93 | 0.38 | 0.38 |
| 03/13/15 | CCXI | SQZ | Y | 8.86 | 8.89 | 95.00 | 8.89 | 0.34 | 0.34 |
| 03/09/15 | RRD | CwH | N | 19.64 | 19.69 | 84.00 | 19.46 | -0.92 | 0.25 |
| 03/13/15 | PRSC | CwH | N | 46.07 | 46.17 | 91.00 | 46.17 | 0.22 | 0.22 |
| Weekly Average (24 breakouts) | 2.67 | 3.79 | |||||||
| *RS Rank on day before breakout. | |||||||||
SqueezePlay is Back
The SqueezePlay watchlist (now called Volatility Squeeze on our menu) had not been updated since January 23 following the introduction of the "percent below breakout price" metric. That metric introduced a bug into the volatility squeeze code that has now been corrected and the watchlist is up-to-date.
Breakoutwatch
Strategies for New (and old) Subscribers
A new subscriber asked me for a suggested strategy for stocks on the the Alert Monitor. I replied that the site offers an information service not specific recommendations so each subscriber must determine their own strategy based on their personal investment style, risk tolerance, investment goals, and so on. I referred him to our newsletter articles for for insights into what does and doesn't work.
There are now 491 newsletters in our archive, so that could be a lot of reading so I have developed a list of the most important articles. Here they are:
Long Position Trading
Options Trading
Additionally, each watchlist has a "methodology" page and "Trading Hints" page which can also be helpful.
A new subscriber asked me for a suggested strategy for stocks on the the Alert Monitor. I replied that the site offers an information service not specific recommendations so each subscriber must determine their own strategy based on their personal investment style, risk tolerance, investment goals, and so on. I referred him to our newsletter articles for for insights into what does and doesn't work.
There are now 491 newsletters in our archive, so that could be a lot of reading so I have developed a list of the most important articles. Here they are:
Long Position Trading
Why stocks with an RS Rank > 90 have a Higher Probability
of Success
NASDAQ Delivers More Breakouts and Higher Returns
Breakoutwatch as a Tool for the CAN SLIM Investor
Influence of Pivot Position and Performance After Breakout
How to Trade Cup and Handle Stocks for Optimal Returns
How to Find Cup and Handle breakouts with a 90% Chance of Success
Important Strategy Revisions
What should be your target gain?
Options Trading
Why the Cup and Handle with Squeeze works for Options Trading
Historical Volatility for Options Trading
Probability of being 'In the Money" on Squeeze Play Alert
Historical Volatility for Options Trading
Probability of being 'In the Money" on Squeeze Play Alert
Additionally, each watchlist has a "methodology" page and "Trading Hints" page which can also be helpful.
| Index | Value | Change Week | Change YTD | Trend | ||||||||||||||||||||||||||||||||||||
|---|---|---|---|---|---|---|---|---|---|---|---|---|---|---|---|---|---|---|---|---|---|---|---|---|---|---|---|---|---|---|---|---|---|---|---|---|---|---|---|---|
| Dow | 17749.3 | -0.6% | -0.41% | Down | ||||||||||||||||||||||||||||||||||||
| NASDAQ | 4871.76 | -1.13% | 2.87% | Up | ||||||||||||||||||||||||||||||||||||
| S&P 500 | 2053.4 | -0.86% | -0.27% | Down | ||||||||||||||||||||||||||||||||||||
1The Market Signal is derived
from our proprietary market model. The market model is
described on the site.
2The site also shows industry rankings based on fundamentals, combined technical and fundamentals, and on price alone. The site also shows daily industry movements. |
||||||||||||||||||||||||||||||||||||||||
|
Category
|
Symbol
|
Company Name
|
Expected Gain1
|
|---|---|---|---|
| Best Overall | RAD | Rite Aid Corporation | 103 |
| Top Technical | RAD | Rite Aid Corporation | 103 |
| Top Fundamental | MDXG | MiMedx Group, Inc | 88 |
| Top Tech. & Fund. | SHPG | Shire plc | 36 |
|
Category
|
Symbol
|
Company Name
|
Expected Gain1
|
|---|---|---|---|
| Best Overall | PGNX | Progenics Pharmaceuticals Inc. | 99 |
| Top Technical | BSFT | BroadSoft, Inc. | 42 |
| Top Fundamental | DG | Dollar General Corporation | 41 |
| Top Tech. & Fund. | PRSC | The Providence Service Corporation | 49 |
If you received this newsletter from a friend and you would like to receive it regularly please go to the BreakoutWatch.com site and enter as a Guest. You will then be able to register to receive the newsletter.
Copyright © 2015 NBIcharts, LLC dba BreakoutWatch.com. All rights
reserved.
" BreakoutWatch," the BreakoutWatch.com "eye" logo, and the slogan
"tomorrow's breakouts today" are service marks of NBIcharts LLC.
All other marks are the property of their respective owners, and
are used for descriptive purposes only.
BreakoutWatch is not affiliated with Investor's Business Daily or
with Mr. William O'Neil. Our site, research and analysis is
supported entirely by subscription and is free from advertising.